 Bullish Portfolio

Introduction to Risk Management in Active Value Investing
Active value investors in 2026 navigate a complex landscape where deep fundamental analysis meets dynamic trading signals. With markets influenced by inflation trends, technological disruptions, and shifting monetary policies, protecting capital is essential. This comprehensive guide details proven techniques to identify risks, size positions effectively, integrate protective measures, and stress-test portfolios for resilience. By blending rigorous value principles with active tactics, investors can pursue opportunities in undervalued assets while mitigating downside exposure.
Identifying Risks Specific to Active Value Strategies
Risk identification forms the foundation of any robust strategy. Active value approaches face overlapping threats from mispriced securities, sudden liquidity shortages, and conflicting signals between short-term momentum and long-term intrinsic worth. Market risks encompass broad economic shifts such as interest rate changes or recessions, while company-specific risks involve earnings disappointments or competitive erosion. Operational risks include execution errors during volatile trading sessions.
To systematically uncover these exposures, investors should employ frameworks like SWOT analysis tailored to value metrics. Reviewing SEC filings for hidden liabilities and cross-referencing with macroeconomic indicators from sources such as the Federal Reserve helps build a complete risk map. In 2026, sector-specific shocks in areas like renewable energy or artificial intelligence supply chains require particular attention to concentration vulnerabilities.
Position Sizing Formulas for Balanced Exposure
Determining the appropriate allocation for each position prevents catastrophic losses from single holdings. The Kelly Criterion, adapted for value contexts, provides a mathematical starting point: Position Size = (Win Probability × Reward-to-Risk Ratio − Loss Probability) / Reward-to-Risk Ratio. For illustration, consider a manufacturing company trading at a 40% discount to book value with an estimated 55% probability of mean reversion within 18 months and a 2.5:1 reward-to-risk profile. Applying the formula suggests a maximum 15% portfolio weight, further reduced by 30-50% to account for estimation uncertainty.
Follow these practical steps for implementation: First, calculate intrinsic value using discounted cash flow models incorporating conservative growth assumptions. Second, assess historical win rates from comparable value recoveries in similar sectors. Third, incorporate volatility adjustments via beta comparisons. Fourth, apply a safety margin and rebalance quarterly. This process ensures diversification across 8-12 core holdings rather than over-concentration in a few names.
Integrating Stop-Loss Orders Without Sacrificing Long-Term Holdings
Stop-loss mechanisms guard against rapid adverse moves yet risk ejecting fundamentally sound positions during temporary market noise. A layered approach works best: set mental stops at 18-25% below entry for permanent holdings, employ trailing stops for tactical overlays, and utilize protective put options on high-conviction names. This preserves the margin of safety central to value investing while capping short-term drawdowns.
Consider a real-world scenario involving a regional bank stock purchased at $52 per share with a calculated intrinsic value of $78. A 22% trailing stop activates only after a sustained decline, allowing tolerance for quarterly earnings fluctuations. If the position represents 12% of the portfolio, pairing it with a 5% allocation to sector ETFs provides additional ballast. Investors should document rules in advance to avoid emotional overrides during stress periods.
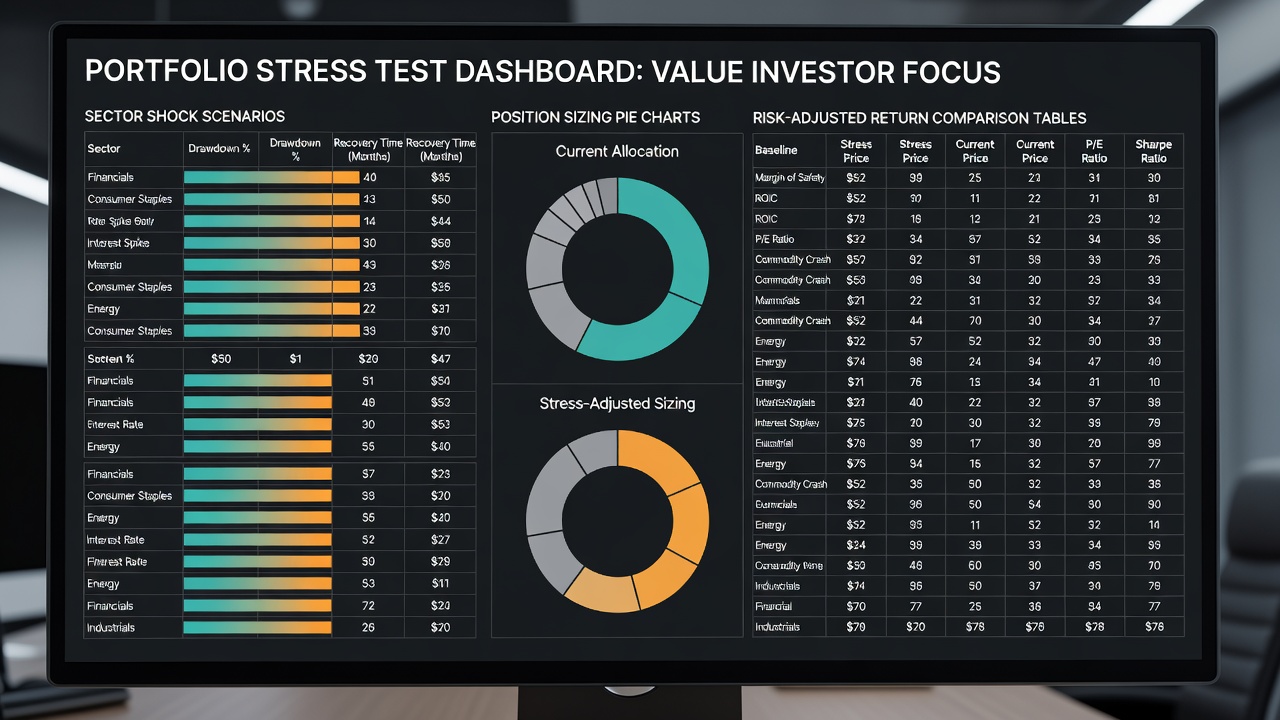
Stress-Testing Portfolios Against Sector Shocks
Portfolio stress testing simulates extreme conditions to reveal hidden fragilities. Construct scenarios around 25-35% sector declines, such as a sudden regulatory overhaul impacting healthcare or materials industries. Run Monte Carlo simulations incorporating correlations observed in 2025 volatility spikes, then evaluate impacts on overall returns, Sharpe ratios, and maximum drawdowns.
A sample comparison table illustrates outcomes:
| Allocation Approach | Baseline Sharpe Ratio | Post-Shock Sharpe Ratio | Maximum Drawdown |
|---|---|---|---|
| Equal-Weighted Value Basket | 0.82 | 0.38 | 29% |
| Position-Sized Active Blend | 1.15 | 0.81 | 19% |
| Hedged Value Core | 1.08 | 0.94 | 14% |
Repeat tests quarterly and after major economic releases. Adjust allocations when any single sector exceeds 25% of total exposure. This proactive method highlights the superiority of dynamic sizing over static diversification.
Diversification and Hedging Strategies
Beyond sizing and stops, true resilience comes from thoughtful diversification across geographies, market caps, and asset classes. Allocate 60-70% to domestic value equities, 15-20% to international developed markets, and 10-15% to alternatives like real estate investment trusts. Hedging via low-cost index options or inverse ETFs during elevated VIX readings above 25 provides an extra layer of defense without undermining long-term compounding.
Practical example: An investor holding a basket of discounted consumer staples and energy names might overlay a 3% portfolio allocation to broad market put spreads expiring in six months. This structure limits tail risk while retaining upside participation in recovery rallies.
Common Pitfalls and Monitoring Tools
Many investors falter by ignoring correlation breakdowns during crises or by chasing yield without margin-of-safety buffers. Overtrading in response to noise and neglecting tax implications of frequent stops also erode returns. To counter these, establish a monitoring routine using platforms that aggregate real-time fundamentals, earnings transcripts, and macroeconomic dashboards. Cross-reference with official disclosures available at SEC.gov for timely updates.
Build checklists for weekly reviews: verify position sizes against targets, re-evaluate stop levels, and scan for new sector risks. Incorporating alerts for key metrics such as debt-to-equity ratios above industry medians prevents surprises.
Conclusion
Implementing these risk management techniques empowers active value investors to thrive amid 2026 uncertainties. Through disciplined identification, precise sizing, flexible protection, and rigorous testing, portfolios gain durability without sacrificing opportunity capture. Consistent application transforms volatile markets into a source of disciplined advantage.
FAQ
How frequently should full portfolio stress tests occur? Conduct comprehensive tests quarterly, with abbreviated scenario checks following significant macroeconomic announcements or sector events.
Which tools best support ongoing risk monitoring? Combine brokerage analytics suites with free resources from the Federal Reserve and SEC for comprehensive coverage of both market data and regulatory filings.
What is the most common pitfall in active value risk management? Over-reliance on a single signal or valuation model without cross-verification against multiple scenarios often leads to outsized losses during unexpected shocks.
How do stop-loss rules interact with tax considerations? Mental stops allow flexibility to harvest losses strategically at year-end while avoiding forced realizations that trigger short-term capital gains taxes.


No comments yet. Be the first!