 Bullish Portfolio
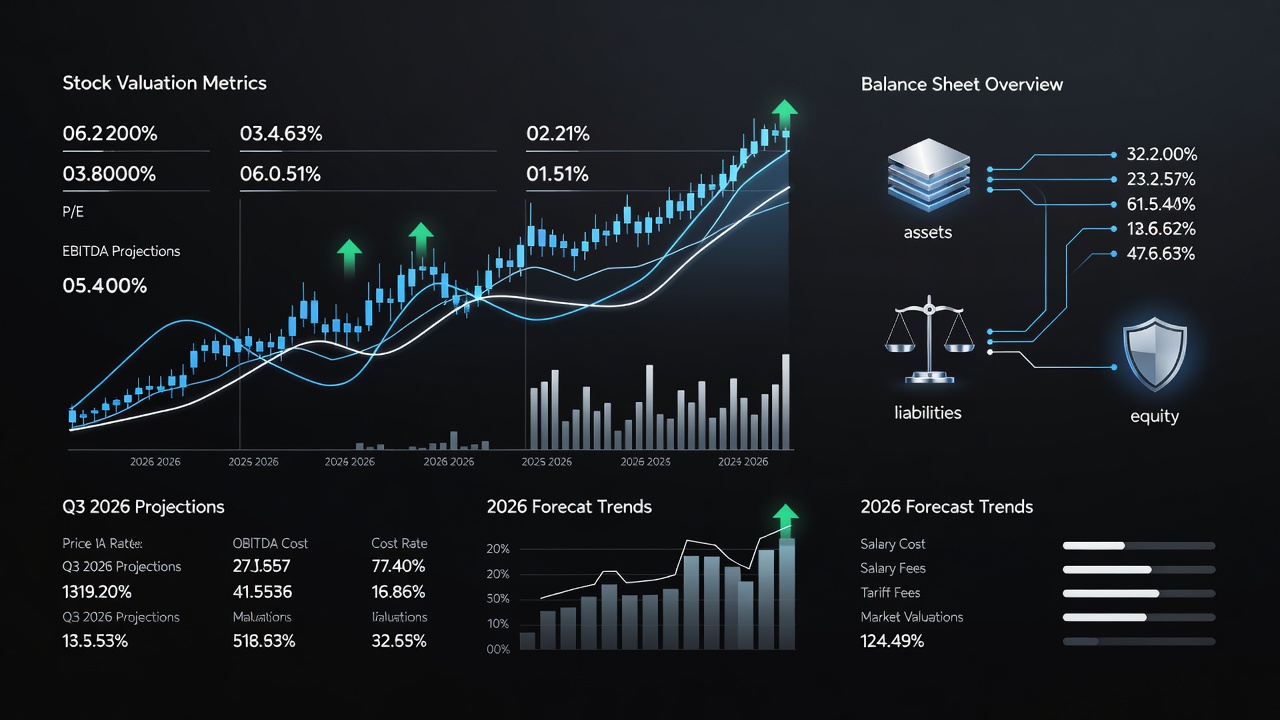
Introduction to Fundamental Analysis in Active Value Investing
Active value investing in 2026 demands a refined approach to fundamental analysis that combines deep financial scrutiny with timely market signals. Investors must move beyond basic metrics to uncover stocks trading below their intrinsic worth while navigating evolving economic conditions such as persistent inflation pressures, technological disruption, and shifting global supply chains. This guide provides practical frameworks, real-world examples from major corporations, and comparisons to purely quantitative methods that often overlook qualitative factors.
Successful value investors prioritize companies with strong economic moats, predictable cash flows, and competent management teams. In today's environment, blending these long-term tenets with active trading indicators such as momentum shifts, volume surges, or sector rotations can enhance returns and reduce drawdowns during volatile periods. The core goal remains identifying a margin of safety where market price sits well below calculated intrinsic value.
Dissecting Financial Statements for Value Opportunities
Begin any analysis by thoroughly examining the three core financial statements. The balance sheet reveals asset quality, liquidity positions, and debt levels, allowing investors to assess whether a company can weather economic downturns. The income statement highlights revenue trends, margin expansion or contraction, and earnings consistency over multiple quarters. Finally, the cash flow statement demonstrates sustainable operations by separating operating cash generation from investing and financing activities.
For instance, scrutinize Apple Inc. (AAPL) filings to assess its substantial cash reserves against long-term liabilities, identifying periods of undervaluation during broad market dips triggered by macroeconomic concerns. Similarly, examine a retailer like Walmart to track inventory turnover and receivables quality as leading indicators of operational health. Focus on red flags such as rising accounts receivable without corresponding revenue growth, declining free cash flow margins despite reported earnings increases, or sudden spikes in goodwill that may signal past over-acquisitions.
Use the SEC EDGAR database to access the latest 10-K and 10-Q reports directly from companies, cross-referencing footnotes for off-balance-sheet items or contingent liabilities that standard ratios might miss.
Calculating Intrinsic Value with Updated DCF Models
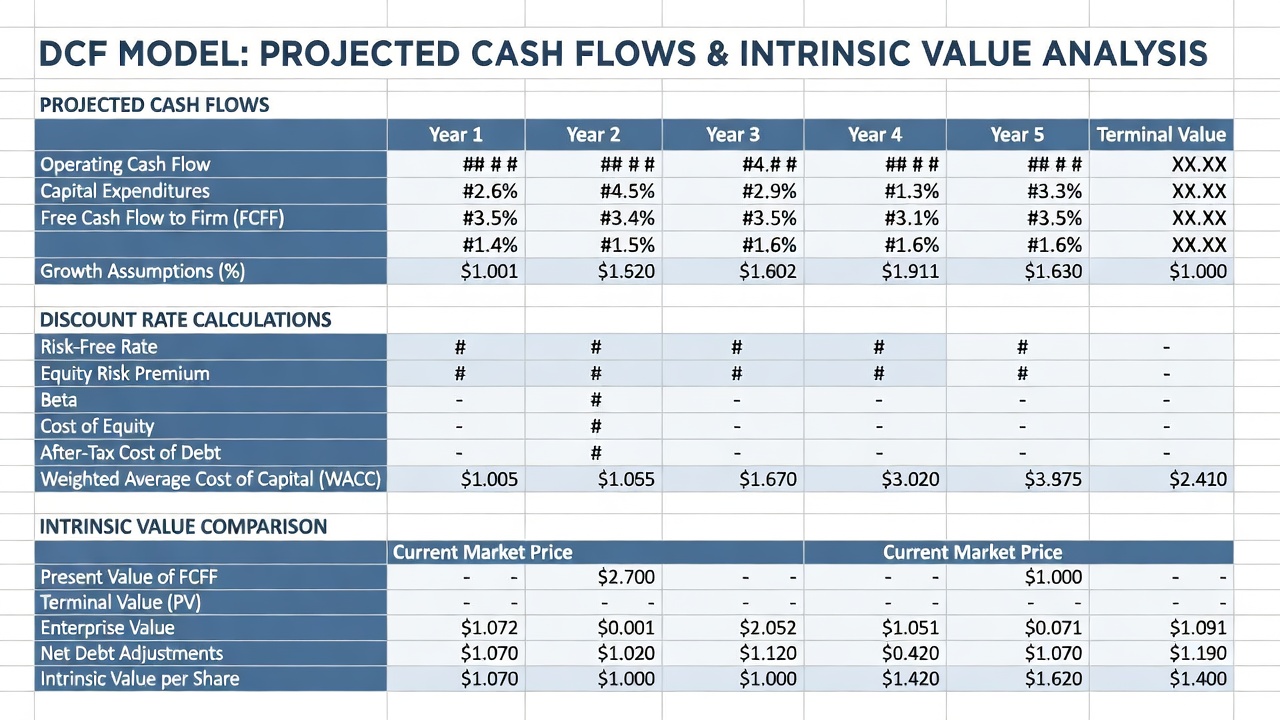
Discounted cash flow (DCF) remains central to valuing stocks in an active framework. Update traditional models for 2026 by incorporating higher discount rates reflecting current interest environments and scenario-based projections for inflation volatility or technological disruption. Start with these detailed steps:
- Project free cash flows for 5-10 years using conservative growth assumptions derived from historical averages adjusted downward for competitive threats.
- Apply a weighted average cost of capital adjusted for company-specific risks such as regulatory exposure or geographic concentration.
- Calculate terminal value with a perpetuity growth method or exit multiple benchmarked against peers, avoiding overly optimistic perpetual growth rates above long-term GDP trends.
- Discount all future cash flows to present value and compare to current market price to determine the margin of safety.
For a diversified holding company like Berkshire Hathaway, this process might reveal undervaluation if market sentiment overlooks its insurance float and operating subsidiaries during equity market corrections. Always stress-test assumptions with sensitivity analysis across base, optimistic, and pessimistic cases to quantify valuation ranges rather than single-point estimates.
Identifying Undervalued Stocks Through Ratio Analysis
Ratio analysis provides quick filters before committing time to full DCF builds. Key metrics include price-to-earnings (P/E), price-to-book (P/B), enterprise value to EBITDA, and free cash flow yield. Compare these against industry peers and the company's own historical averages to spot anomalies. A low P/B ratio below 1.0 often signals potential value, but verify asset quality and any hidden liabilities first.
- Screen for stocks with P/E under sector medians yet positive earnings growth trajectories supported by secular tailwinds.
- Evaluate return on equity (ROE) above 15% sustained over five years as evidence of efficient capital allocation.
- Monitor debt-to-equity ratios under 0.5 alongside interest coverage multiples exceeding 5x to avoid leverage risks in rising-rate environments.
- Track return on invested capital (ROIC) trends to confirm economic profit creation beyond cost of capital.
Real-world application: During 2025-2026 volatility, value hunters applied these ratios to energy and financial sectors to spot opportunities missed by momentum traders chasing high-growth narratives. Combine ratios into a composite score for systematic screening before qualitative review.
Step-by-Step Evaluation Framework
Follow this actionable sequence to integrate fundamental analysis with active signals:
- Screen broadly using ratio thresholds via financial platforms while excluding companies with recent accounting restatements.
- Review latest filings and management commentary transcripts for qualitative insights on strategy execution and competitive positioning.
- Build and iterate DCF models with multiple macroeconomic scenarios tied to Federal Reserve projections.
- Cross-reference with active indicators like relative strength index readings or unusual options activity for entry timing.
- Assess macroeconomic factors such as employment trends and inflation data from the Bureau of Labor Statistics.
- Decide on position sizing based on calculated margin of safety, typically limiting any single holding to 5-8% of portfolio value.
Comparing Fundamental Analysis to Quantitative Approaches
Quantitative strategies rely on algorithms and backtested data for speed and scale, excelling in high-frequency environments where patterns repeat reliably. However, they often overlook nuanced factors like management quality, brand strength, or emerging competitive advantages that fundamental analysis captures through careful statement review. Active value investors gain an edge by layering quant signals onto rigorous bottom-up research, avoiding the pitfalls of over-optimization seen in pure quant funds during regime shifts such as sudden policy changes or geopolitical events.
Adapting Analysis for Emerging Economic Shifts in 2026
2026 markets feature unique variables including accelerated AI integration across industries and evolving trade policies. Update models by stress-testing revenue projections against potential tariff impacts and incorporating scenario weights for higher-for-longer interest rates. Review supply chain disclosures in 10-K filings to identify reshoring beneficiaries versus import-dependent firms. This forward-looking adaptation prevents the common error of anchoring solely to pre-2025 data.
Common Mistakes to Avoid
Investors frequently over-rely on trailing twelve-month ratios without normalizing for cyclical peaks or troughs. Another pitfall involves ignoring off-balance-sheet obligations revealed only in footnotes. Maintain discipline by documenting all assumptions in a valuation memo and revisiting positions quarterly rather than reacting to daily price movements.
FAQs on Common Pitfalls and Adaptations
How do I avoid overreliance on historical data?
Always forward-adjust projections for emerging trends like AI adoption or supply chain changes rather than extrapolating past averages blindly, and weight recent quarters more heavily in trend analysis.
What if economic shifts invalidate my models?
Re-run DCF scenarios quarterly and incorporate leading indicators such as PMI data or commodity prices from government sources to adapt quickly without discarding the overall framework.
Is fundamental analysis still relevant versus quant tools in 2026?
Yes, it provides the qualitative depth quant models lack, especially when identifying durable competitive advantages amid rapid innovation cycles that algorithms may misprice temporarily.
Should I combine active signals with value analysis?
Yes, using volume or momentum overlays helps time entries after fundamental undervaluation is confirmed, improving overall risk-adjusted returns compared to pure buy-and-hold value strategies.
Conclusion
Mastering these fundamental analysis techniques equips active value investors to thrive in 2026's dynamic markets. By combining detailed statement review, robust DCF modeling, and ratio discipline with active timing, you can systematically uncover and act on undervalued opportunities while mitigating risks from outdated assumptions or unadjusted economic variables.


No comments yet. Be the first!