 Bullish Portfolio
Introduction: Why Macro Indicators Matter for Value Investors in 2026
Active value investing requires more than traditional screening for low price-to-earnings ratios or high dividend yields. In 2026, macroeconomic releases provide critical context that helps investors time entries and exits more effectively. Economic indicators reveal whether a cheap stock is genuinely undervalued or simply caught in a deteriorating business cycle. Without this layer of analysis, investors risk buying into value traps where apparent bargains face structural headwinds from slowing growth or rising costs. This guide examines the most relevant indicators, shows how to extract value signals from each release, and provides a step-by-step integration framework you can apply immediately. By combining bottom-up fundamental research with top-down macro awareness, active investors can improve risk-adjusted returns and avoid common timing errors that plague purely quantitative screens.
Key Economic Indicators That Influence Value Opportunities
Inflation Trends and Their Impact on Valuation Multiples
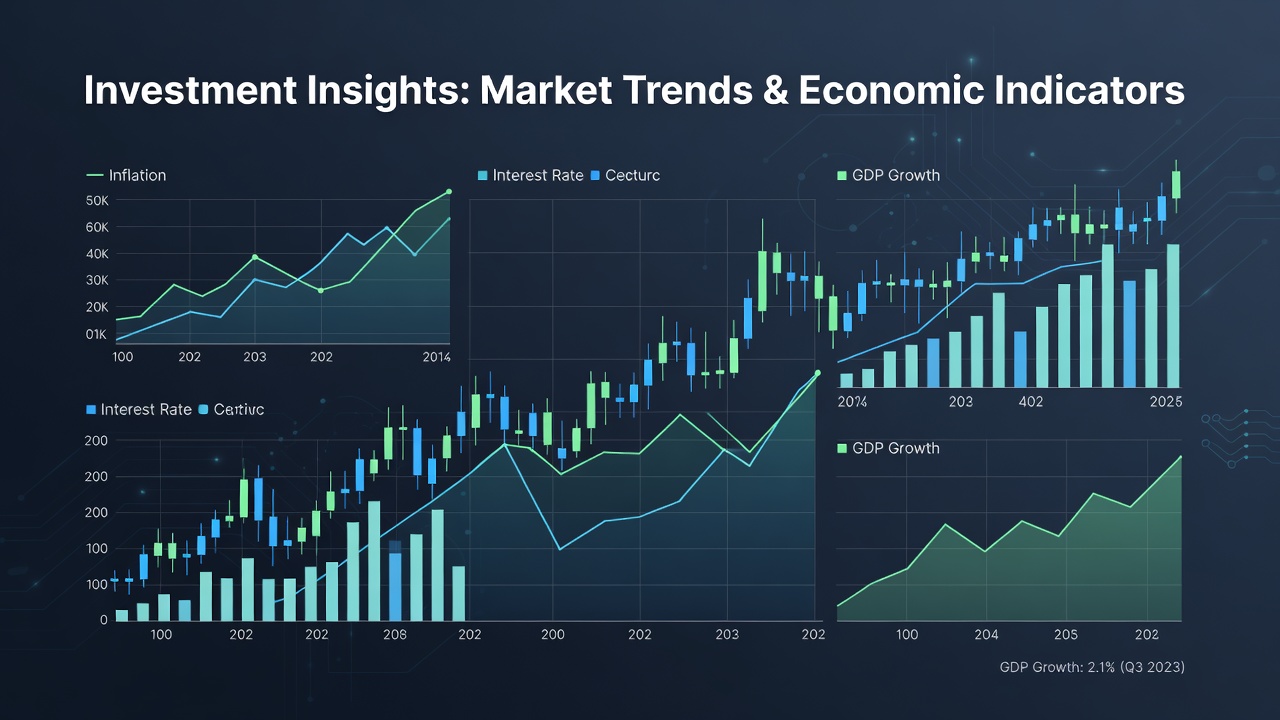
Persistent inflation erodes real earnings and compresses multiples. Monitor the Consumer Price Index and core PCE readings released monthly. When inflation moderates after a period of tightness, value stocks in cyclical sectors often re-rate upward as investors regain confidence in sustainable margins. Conversely, re-accelerating inflation can signal margin pressure for companies with weak pricing power, particularly in consumer discretionary or small-cap value names. Understanding the difference between headline and core measures helps separate transitory noise from persistent trends that affect long-term valuations.
Interest Rate Shifts and Discount Rates
The Federal Reserve’s policy path directly affects the discount rate applied to future cash flows. Rising rates disproportionately hurt high-duration growth names, creating relative bargains in mature value sectors such as financials and utilities. Track the federal funds rate path, dot plot projections, and Treasury yield curve for early signals of policy pivots. Yield curve inversions have historically preceded recessions, prompting value investors to favor defensive sectors with stable cash flows.
GDP Growth and Sector Rotation
Real GDP prints and revisions highlight economic momentum. Strong growth supports cyclical value plays such as industrials, materials, and financials, while contraction favors defensive value areas like utilities, healthcare, and consumer staples. Quarterly GDP reports from the Bureau of Economic Analysis also include breakdowns by component, allowing investors to identify which sectors are likely to benefit or suffer.
Employment Data and Consumer Strength
Nonfarm payrolls, unemployment rates, and wage growth from the Bureau of Labor Statistics provide insight into consumer health. Robust labor markets support value stocks tied to domestic consumption, while weakening employment trends may prompt earlier exits from cyclical holdings.
Identifying Value Signals from Economic Releases
Value signals emerge when macro data diverges from market expectations. A softer-than-expected inflation print combined with resilient GDP often marks the start of a value rotation into rate-sensitive sectors. Create a simple scoring system: assign +1 for favorable data surprises in each indicator category and -1 for adverse surprises. Stocks showing improving fundamentals that also score positively on macro alignment warrant deeper fundamental review. For example, a bank trading at 0.8 times tangible book value may warrant increased allocation after two consecutive positive macro scores, whereas the same stock could be avoided during negative macro alignment even if the screen flags it as cheap.
Step-by-Step Integration Framework
- Compile a watchlist of fundamentally cheap stocks using standard screens such as low enterprise-value-to-EBITDA or high free-cash-flow yield.
- Overlay the latest macro calendar and note release dates for CPI, employment reports, and GDP.
- Quantify each release against consensus forecasts and assign macro scores using a consistent methodology.
- Adjust position sizing dynamically: increase allocations when macro scores align with company-specific catalysts; reduce or hedge when divergence appears.
- Rebalance quarterly or immediately after major data surprises that shift the macro outlook.
- Document decisions in a trading journal to refine the process over multiple market cycles.

Real-World Portfolio Examples
Consider a hypothetical 2026 portfolio overweight in financials and energy. After the January CPI release showed cooling inflation, the portfolio added positions in regional banks trading below tangible book value. When subsequent GDP data confirmed steady growth, the same holdings were increased by a measured amount. Another example involves a value investor rotating into industrial names ahead of strong Q2 GDP revisions while trimming exposure to utilities that had become over-owned during the prior defensive phase. These macro-informed adjustments improved entry timing versus pure bottom-up screening alone.
Comparisons Against Traditional Screening Methods
Traditional screens ignore the broader environment and frequently generate false positives. A stock may appear cheap on trailing metrics yet face earnings downgrades in a slowing economy. Integrating macro indicators adds a forward-looking layer that reduces drawdowns. Backtests covering multiple cycles show that macro-augmented value strategies exhibit lower maximum drawdowns during recessions compared with static value screens. The hybrid approach also improves Sharpe ratios by avoiding value traps during adverse macro regimes.
Actionable Checklists and Risk Considerations
- Verify data sources directly from official statistical agencies before acting on any release.
- Account for revisions—initial prints are frequently adjusted in subsequent months.
- Monitor geopolitical risks that can override domestic indicators and create sudden volatility.
- Maintain position limits to avoid concentration during uncertain macro regimes.
- Review correlation between your holdings and the business cycle on a quarterly basis.
- Use multiple indicators rather than relying on a single data point for confirmation.
- Stress-test portfolio performance against historical scenarios such as 2008 or 2020 macro shocks.
Frequently Asked Questions
How often should I update macro scores?
Review after every major release; most investors find a weekly cadence sufficient outside of crisis periods when daily monitoring becomes necessary.
Can small investors access the same data as institutions?
Yes. All core indicators are freely available from government agencies such as the Federal Reserve and Bureau of Economic Analysis.
What is the biggest timing pitfall?
Overreacting to a single data point. Always wait for confirmation across at least two indicators before making material allocation changes.
Should macro analysis replace fundamental research?
No. Macro data serves as a filter and timing tool that enhances, rather than replaces, company-specific due diligence.
Conclusion
Macroeconomic indicators supply the missing context that transforms basic value screens into robust, cycle-aware strategies. By systematically tracking inflation, interest rates, GDP, and employment data, active investors can improve entry and exit decisions throughout 2026 and beyond while managing downside risk more effectively.


No comments yet. Be the first!