 Bullish Portfolio
Introduction to ETF Liquidity in 2026 Markets
ETF liquidity plays a critical role in investment decisions, especially when retail investors blend sector-specific ETFs with broad index funds. In 2026 market conditions, understanding liquidity helps minimize trading costs and slippage, ensuring efficient execution of trades. This comprehensive guide explores key metrics, comparisons, and practical strategies to navigate these dynamics effectively, providing retail investors with actionable insights for building resilient portfolios amid evolving market environments.
Liquidity influences every aspect of ETF trading, from entry and exit points to overall portfolio performance. When blending sector ETFs, which focus on industries like technology or healthcare, with broad index funds that track major benchmarks, investors must account for differences in trading efficiency. Poor liquidity can lead to unexpected costs that erode returns over time, making it essential to prioritize this factor during portfolio construction in 2026.
Defining ETF Liquidity Metrics
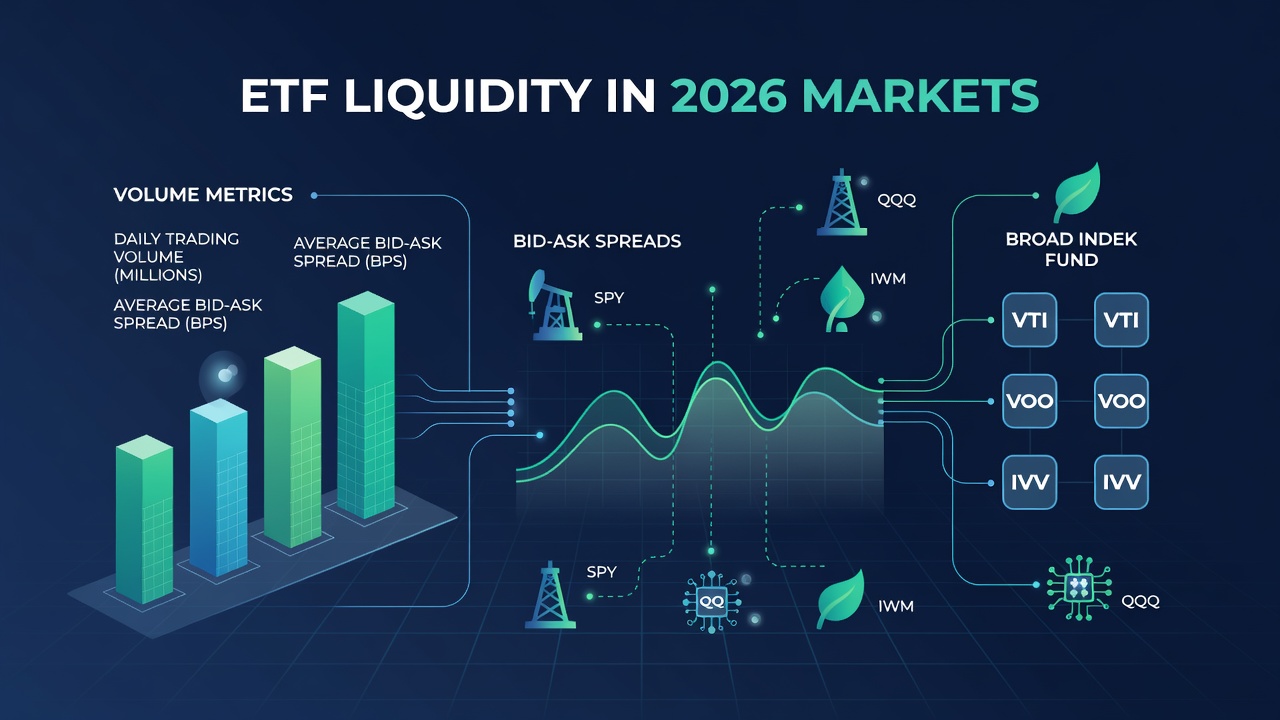
Liquidity in ETFs is measured through several key indicators. Average daily trading volume indicates how many shares change hands regularly, while bid-ask spreads reveal the cost difference between buying and selling prices. Other metrics include assets under management (AUM) and the tightness of spreads relative to underlying holdings. High liquidity reduces the risk of price impact during large trades.
Additional considerations involve the depth of the order book, which shows available buy and sell orders at various price levels, and the correlation between ETF trading activity and the liquidity of its underlying securities. Investors should also examine premium or discount to net asset value (NAV), as deviations can signal liquidity stress. These metrics collectively provide a full picture of how easily an ETF can be traded without significant price disruption.
Comparing High-Liquidity Sector ETFs Versus Index Funds
Sector ETFs often exhibit varying liquidity levels compared to broad index funds. Broad market funds like those tracking the S&P 500 typically offer superior liquidity due to massive trading volumes. Sector ETFs, focused on areas like technology or energy, can provide targeted exposure but may face wider spreads during volatile periods. Investors must weigh these factors when constructing portfolios that mix both types for diversification.
High-liquidity options generally feature tighter spreads and higher volumes, lowering overall transaction expenses. In contrast, less liquid sector ETFs might incur higher costs, particularly for frequent traders. Evaluating these differences supports informed blending strategies in 2026. For example, a core holding in a broad index fund can anchor the portfolio, while satellite sector positions add growth potential without compromising too much on execution quality if chosen carefully.
Real-World Examples of Bid-Ask Spreads
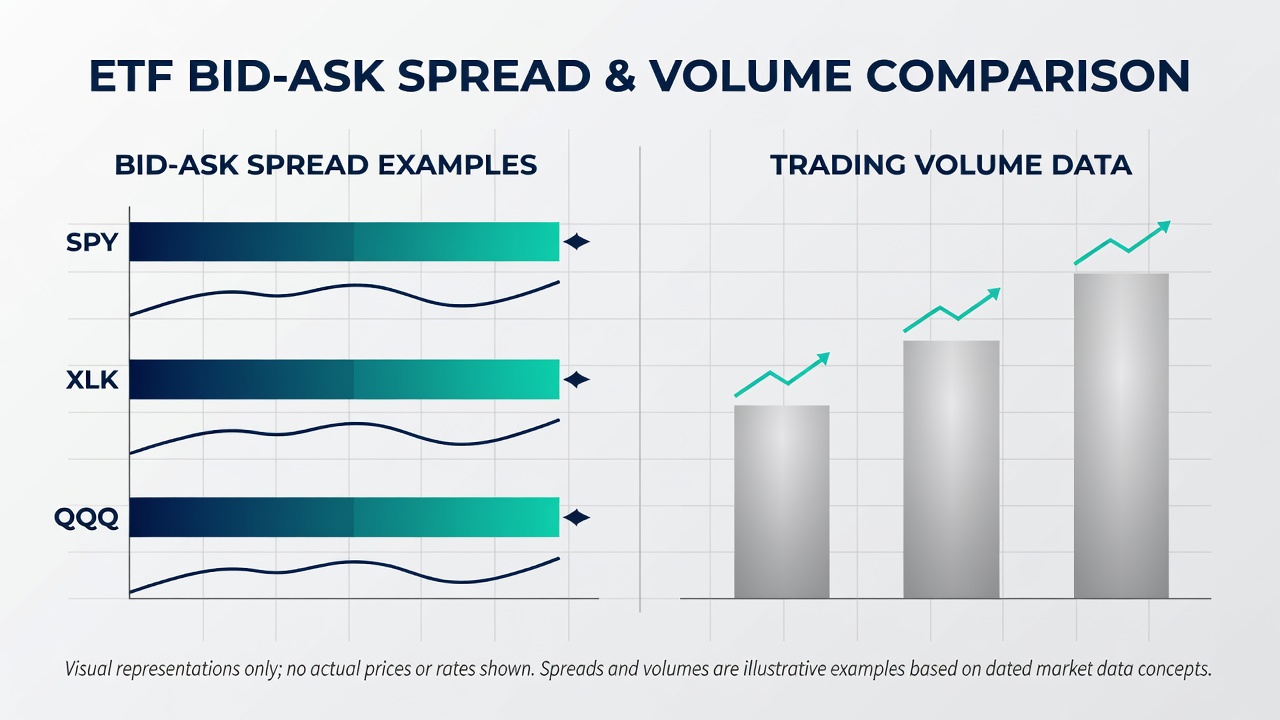
Bid-ask spreads serve as a direct indicator of liquidity costs. For instance, popular broad index ETFs often maintain spreads under 0.05% during normal trading hours, while certain sector ETFs may see spreads expand to 0.10% or more amid market stress. These real-world variations highlight the importance of timing trades during peak volume periods to capture better pricing.
Understanding these examples helps investors anticipate scenarios where liquidity dries up, such as during earnings seasons or geopolitical events. By reviewing historical spread data, traders can identify patterns and adjust their strategies accordingly, ensuring that blending decisions do not inadvertently increase exposure to hidden costs.
Step-by-Step Methods to Evaluate Volume Data
To assess ETF liquidity effectively, follow these steps:
- Review average daily volume over the past 30 days using reliable financial platforms.
- Compare current spreads against historical averages to detect anomalies.
- Analyze AUM trends and underlying asset liquidity for deeper insights.
- Monitor order book depth during different market sessions.
- Cross-reference with sector-specific news that could influence trading activity.
This systematic approach empowers retail investors to select ETFs that align with low-cost objectives. Expanding on each step, investors should also consider seasonal patterns in volume and use multiple data sources to validate findings, creating a robust evaluation framework that accounts for both quantitative metrics and qualitative market signals.
Practical Comparisons of Popular Tickers
Consider tickers such as SPY for broad market exposure versus sector options like XLK for technology. SPY typically demonstrates higher volume and narrower spreads, making it ideal for core holdings. Sector ETFs may suit tactical allocations but require careful liquidity checks. Investors can use these comparisons to optimize blends that balance growth potential with execution efficiency. Additional tickers like QQQ or XLF offer further options for diversification, each with distinct liquidity profiles that should be assessed based on current trading conditions.
Strategies to Minimize Trading Costs and Slippage
Key tactics include trading during high-volume market hours, using limit orders, and favoring ETFs with strong underlying liquidity. Diversifying across multiple liquid vehicles rather than concentrating in niche sectors also helps. Monitoring economic calendars avoids periods of elevated volatility that widen spreads. Implementing these strategies consistently can lead to meaningful savings over multiple trades throughout the year.
Understanding Slippage and Its Impact on Blended Portfolios
Slippage occurs when the executed price differs from the expected price due to market movement or low liquidity. In blended portfolios, this effect compounds when shifting between sector and index positions. Practical mitigation involves setting alerts for volume thresholds and preferring ETFs with robust market-maker support to maintain tight pricing even in fluctuating conditions.
Tools and Resources for Ongoing Liquidity Monitoring
Retail investors benefit from leveraging free and paid platforms that display real-time volume and spread data. Combining these with official regulatory resources ensures accurate decision-making. Regular reviews help adapt to 2026 market shifts, keeping portfolios aligned with liquidity best practices.
Common Liquidity Pitfalls and How to Avoid Them
- Overlooking after-hours trading impacts on spreads.
- Ignoring low-volume days that amplify slippage risks.
- Selecting sector ETFs without verifying AUM stability.
- Failing to compare multiple data sources for accurate volume metrics.
Each pitfall can be avoided through disciplined routines, such as maintaining a checklist before executing trades and educating oneself on market microstructure basics.
Frequently Asked Questions
What is the best way to check ETF liquidity before investing?
Use volume and spread data from established market tools, focusing on 30-day averages for reliable insights. Supplement this with reviews of underlying holdings and news sentiment to gain a complete understanding.
How does liquidity differ between sector ETFs and index funds?
Broad index funds usually offer tighter spreads and higher volumes, while sector ETFs vary based on popularity and market conditions. This difference influences the suitability of each for short-term versus long-term allocations.
Can poor liquidity increase my trading costs significantly?
Yes, wider spreads and slippage can erode returns, especially for active traders blending multiple ETF types. Over time, these costs accumulate and may outweigh the benefits of certain sector exposures.
Are there tools recommended by regulators for liquidity analysis?
Resources from the SEC and Investor.gov provide guidance on ETF evaluation and trading best practices. Additional insights can be found through established market oversight bodies.
How should investors adjust strategies during periods of low overall market liquidity?
Focus on the most liquid core holdings, reduce position sizes in sector ETFs, and extend time horizons for entries and exits to minimize adverse price impacts.
Conclusion
Mastering liquidity strategies enhances ETF investing outcomes in 2026 by reducing unnecessary costs. By applying the metrics, comparisons, and evaluation methods outlined, retail investors can build resilient portfolios that blend sector and index exposure efficiently. Stay informed and prioritize liquidity data for optimal results across various market environments.

No comments yet. Be the first!