 Bullish Portfolio
Introduction to ETF Screening for Balanced Portfolios
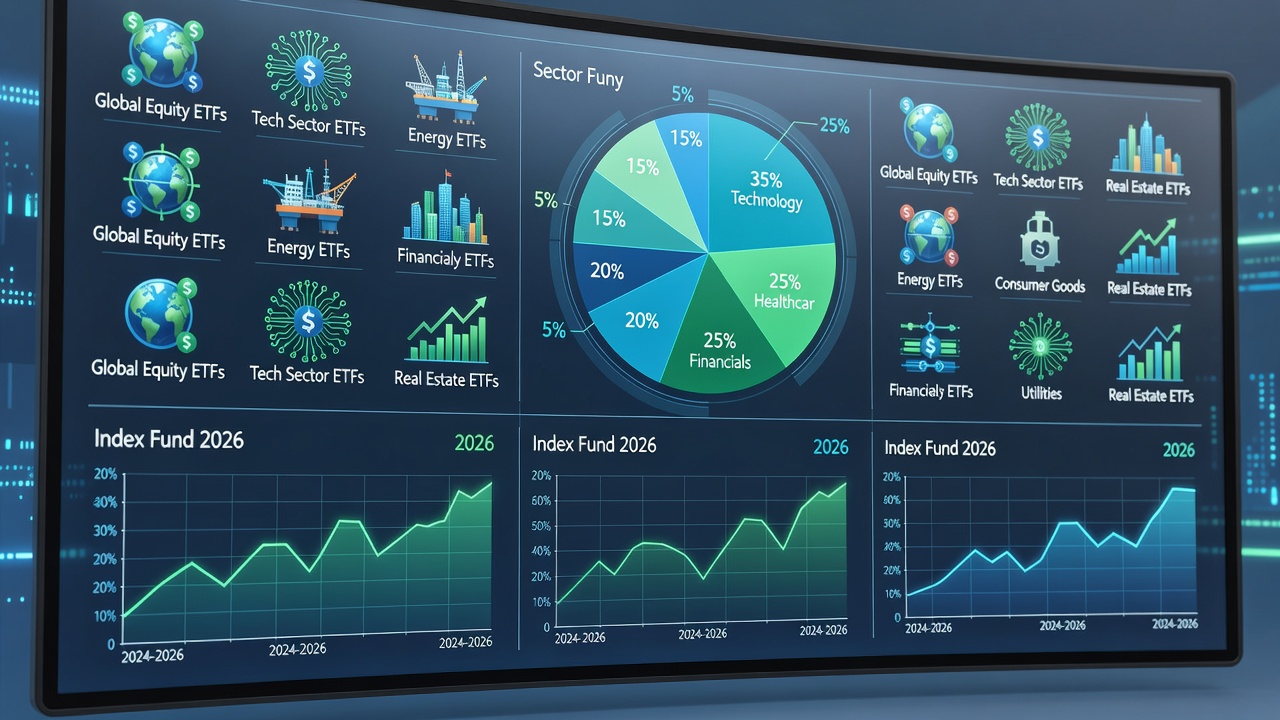
Building a resilient investment portfolio in 2026 requires careful selection of ETFs that combine the broad stability of index funds with targeted exposure from sector ETFs. Investors increasingly turn to data-driven screening to identify optimal mixes that align with market conditions while managing risk. This guide walks through proven techniques to evaluate ETFs based on key metrics, helping you avoid common pitfalls like over-concentration. Effective screening starts with understanding your goals, such as growth, income, or diversification. By focusing on tools and quantifiable criteria rather than hype, you can construct allocations that perform across varying economic scenarios. In today's dynamic environment, where sector rotations can occur rapidly due to technological advancements and policy shifts, mastering these methods provides a competitive edge for both novice and experienced investors alike.
Screening is not merely about picking high performers but about creating synergy between broad market exposure and specialized sector bets. Index funds serve as the foundation, offering low-cost access to entire markets, while sector ETFs enable precise adjustments to capitalize on emerging trends. This article delves deep into the process, providing actionable steps, real examples, and strategies tailored for 2026 conditions.
Understanding ETF Screening Basics
ETF screening involves filtering thousands of available funds using criteria like performance history, costs, and holdings overlap. In 2026, with evolving market dynamics, this process emphasizes liquidity and sector balance to mitigate volatility. Core index funds provide market-wide exposure, while sector ETFs allow tactical bets on areas like technology or healthcare. The goal is synergy: index funds anchor the portfolio, and sector ETFs enhance returns without excessive overlap. Screening tools from major providers streamline this by allowing custom filters that incorporate both quantitative data and qualitative factors such as management quality and index methodology.
Furthermore, understanding the distinction between passive index tracking and active sector strategies is crucial. Passive index ETFs aim to replicate benchmarks like the S&P 500 with minimal deviation, whereas sector ETFs focus on industries that may outperform during specific cycles. Screening helps identify funds where these approaches complement rather than compete, ensuring efficient capital allocation.
The Role of Sector ETFs Versus Core Index Funds
Sector ETFs offer concentrated exposure to industries such as energy, financials, or consumer discretionary, allowing investors to overweight areas expected to thrive amid 2026 economic forecasts. In contrast, core index funds deliver diversified holdings across large, mid, and small caps, reducing the impact of any single sector's downturn. When blending the two, screening must evaluate correlation coefficients to ensure the sector component adds true diversification rather than redundancy. For example, a technology sector ETF might overlap significantly with a broad equity index if not carefully chosen, leading to unintended risk amplification during market corrections.
Practical integration involves starting with 70-80% allocation to index funds for stability and layering 20-30% in screened sector ETFs for growth potential. This balance adapts to 2026's anticipated volatility from interest rate changes and geopolitical factors.
Key Screening Criteria for ETFs
Successful screening hinges on several essential factors. Prioritize these to ensure your selections support a balanced mix:
- Expense Ratios: Lower costs compound over time, so target funds with competitive fees that do not erode returns. Focus on ratios that remain efficient even after accounting for trading spreads in less liquid sectors.
- Liquidity: High average daily trading volume ensures easy entry and exit without wide bid-ask spreads. This is vital for sector ETFs that may experience sudden inflows during thematic rallies.
- Sector Overlap: Analyze holdings to prevent unintended concentration in one industry across multiple ETFs. Use overlap analysis tools to quantify shared positions and adjust accordingly.
- Tracking Error: Measure how closely an ETF follows its benchmark to confirm reliability, especially important for index funds meant to provide consistent market representation.
- Assets Under Management: Larger AUM often signals stability and tighter spreads, reducing the risk of fund closure or liquidity issues in volatile periods.
Evaluating sector overlap is particularly critical in 2026 to avoid duplicative exposure that amplifies downturns in specific industries. Additional considerations include dividend yield consistency and tax efficiency metrics for taxable accounts.
Step-by-Step Guide to Using Popular ETF Screeners
Follow these instructions to screen ETFs effectively using widely available tools:
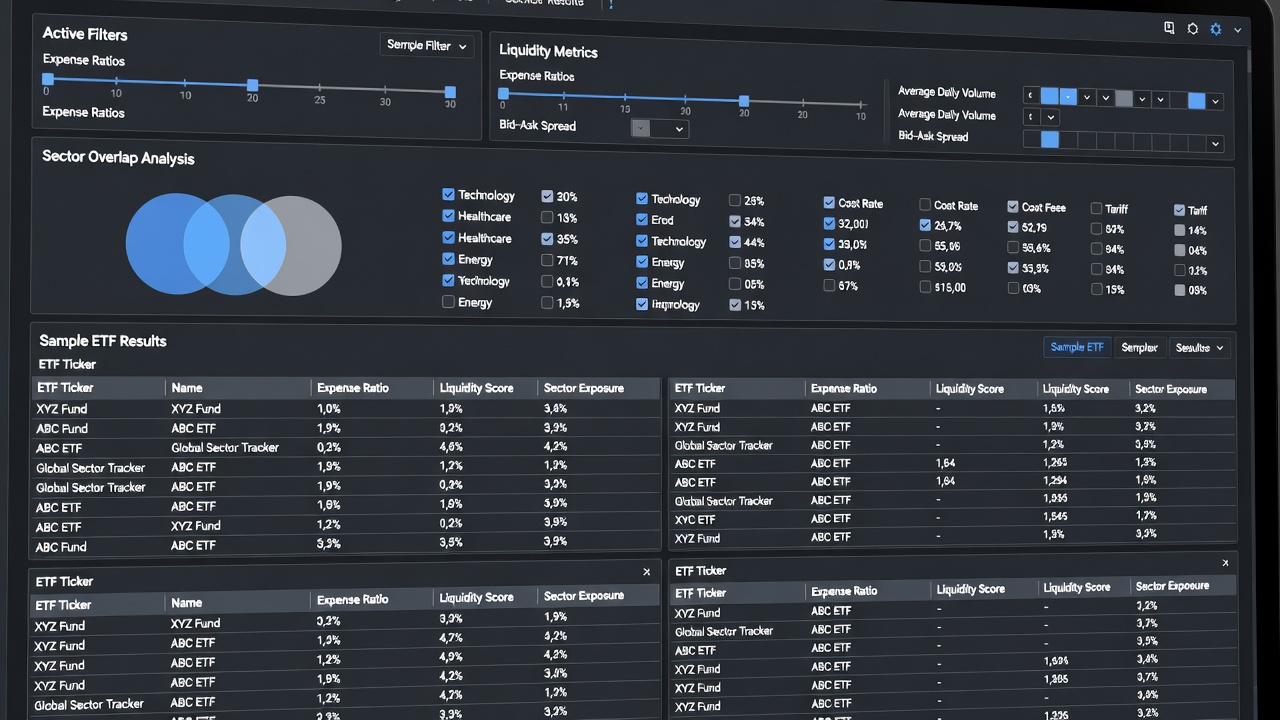
- Access a reputable screener platform and set baseline filters for asset class (equity) and fund type (ETF).
- Apply expense ratio thresholds under 0.5% where possible, then refine by liquidity metrics exceeding 100,000 shares daily.
- Incorporate sector filters to select complementary exposures, such as pairing a broad S&P 500 index ETF with targeted healthcare or energy sector funds.
- Review holdings overlap reports and adjust to maintain diversification below 20% concentration in any single sector.
- Export results and backtest hypothetical allocations against recent market data for validation.
- Cross-check with fundamental data like earnings growth projections and macroeconomic indicators relevant to 2026.
This methodical approach ensures selections are objective and aligned with 2026 conditions. Repeat the process periodically to adapt to new data releases.
Advanced Metrics and Platform Comparisons
Beyond basic filters, advanced users examine metrics such as Sharpe ratios for risk-adjusted returns and beta values to assess market sensitivity. Popular platforms differ in depth: some excel at holdings visualization while others provide robust backtesting capabilities. Comparing results across multiple screeners helps validate findings and uncover nuances missed by a single tool.
Comparing Sample ETF Pairings
Direct comparisons reveal strengths in blending. For instance, pairing a total market index ETF with a technology sector ETF can boost growth potential while the index component provides ballast. Evaluate metrics side-by-side: one pairing might show lower tracking error but higher overlap, requiring tweaks. Real-world testing in 2026 scenarios highlights how certain mixes outperform during sector rotations driven by innovation cycles or regulatory changes.
Real-World 2026 Portfolio Allocation Examples
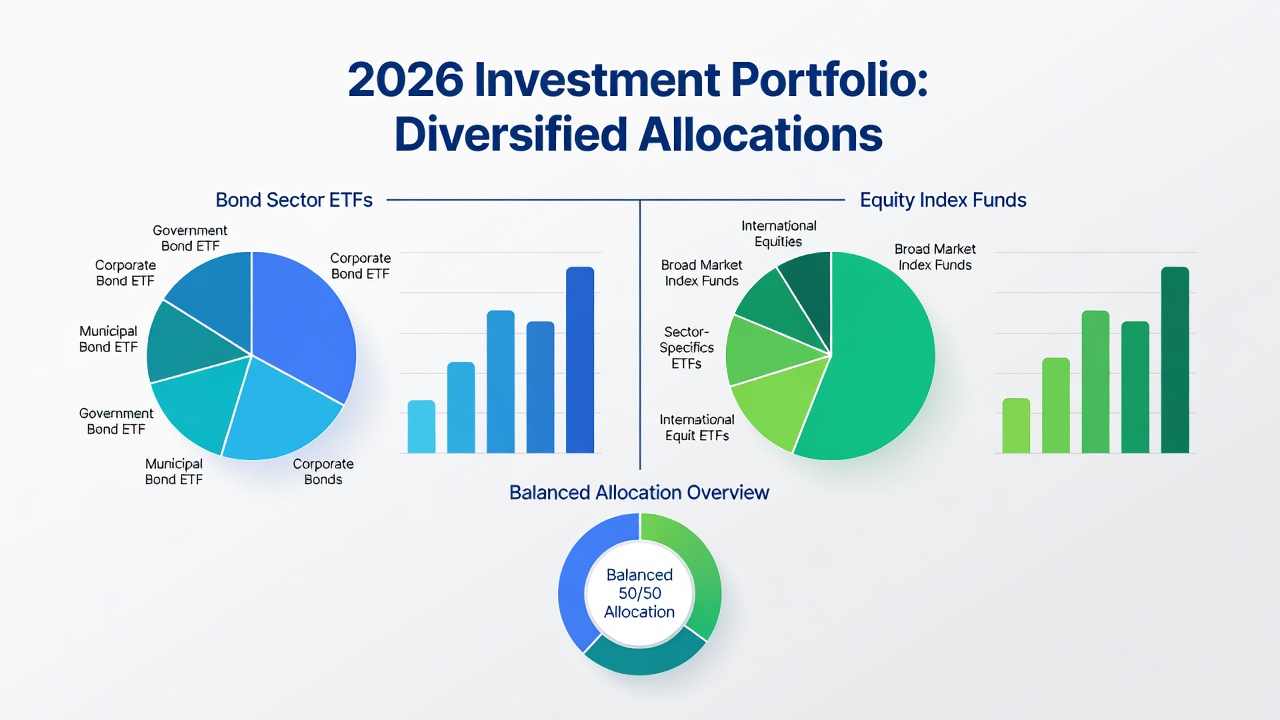
Consider a moderate-risk allocation: 60% in a broad U.S. equity index ETF, 15% in a global ex-U.S. index fund, 10% technology sector ETF, 8% healthcare sector ETF, and 7% in a bond index ETF for stability. Adjust based on screening outputs to emphasize underrepresented sectors like renewables or infrastructure. Another example might tilt toward defensive sectors if economic indicators signal slowdowns, replacing some growth-oriented holdings with utilities-focused ETFs. These examples demonstrate how quantitative filters translate into actionable portfolios that withstand 2026-specific challenges.
Common Mistakes and How to Avoid Over-Concentration
Investors often overlook hidden overlaps or chase high-performing sectors without regard for costs. To avoid this, always cross-reference holdings data and maintain position sizes under 15% per sector ETF. Regular re-screening quarterly helps adapt to shifting market weights in 2026. Other errors include ignoring liquidity during stress periods and failing to account for currency risks in international sector ETFs.
Frequently Asked Questions
What is the ideal number of ETFs in a screened portfolio?
Most balanced portfolios use 5-8 ETFs to achieve diversification without complexity, allowing room for fine-tuning based on screening insights.
How often should screening be repeated?
Review allocations at least quarterly or after major market events to maintain optimal mixes and respond to evolving sector dynamics.
Can screening tools predict 2026 performance?
They provide data-driven insights but cannot guarantee future results; combine with fundamental analysis and economic outlooks for better decision-making.
How do I handle tax implications during screening?
Prioritize ETFs with low turnover and consider location strategies such as holding tax-inefficient sector funds in tax-advantaged accounts.
Conclusion
Mastering ETF screening empowers investors to create robust mixes of sector and index funds tailored for 2026. By applying the criteria and steps outlined, you can build portfolios that balance opportunity with risk management. Start with a screener today and refine based on your unique objectives for long-term success. For official guidance on ETF investing, consult the U.S. Securities and Exchange Commission and Investor.gov. Additional resources are available at the Investment Company Institute.
No comments yet. Be the first!