 Bullish Portfolio

Introduction
Investors entering 2026 face evolving market dynamics that demand precise ETF evaluation beyond surface-level screening. This guide delivers a comprehensive framework for analyzing core ETF metrics, helping you build resilient portfolios amid sector rotations and index fund competition. By mastering expense ratios, tracking error, liquidity, and holdings overlap, you can make informed decisions that align with long-term objectives. The 2026 landscape includes potential shifts in interest rates, technological advancements, and geopolitical factors that influence ETF performance. Understanding these elements allows investors to move past basic selection and adopt advanced techniques tailored to current conditions.
Whether you are refining an existing allocation or constructing a new strategy, understanding these metrics equips you with advanced techniques that go far beyond basic selection criteria. Data-driven approaches help mitigate risks associated with market volatility and ensure your portfolio remains optimized for growth and stability throughout the year.
Core ETF Metrics Explained
Expense Ratios
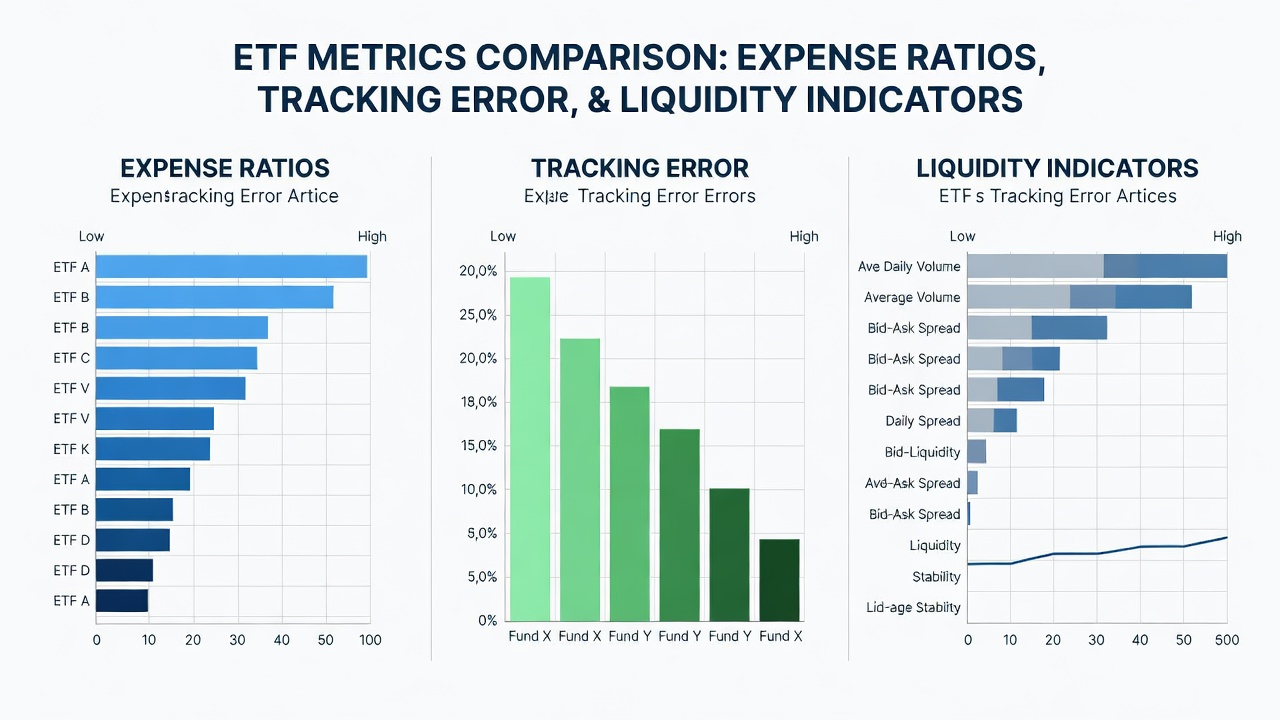
Expense ratios represent the annual cost of fund management expressed as a percentage of assets. Lower ratios preserve returns over time, especially in large allocations. Focus on total expense ratios that include management fees and operational costs when comparing options across providers. In practice, an ETF with a 0.05% expense ratio will cost significantly less than one at 0.25% over a decade-long holding period. Investors should examine the breakdown of these fees, including any hidden costs like securities lending revenue that might offset expenses. For 2026, monitoring how expense ratios interact with expected returns in different economic scenarios is essential for maintaining portfolio efficiency.
Tracking Error
Tracking error measures how closely an ETF replicates its benchmark index. Lower values indicate better replication efficiency. Calculate this by examining standard deviation of the difference between ETF and index returns over multiple periods, including volatile market phases expected in 2026. For instance, an ETF tracking the S&P 500 with a tracking error of 0.10% demonstrates strong alignment, while higher errors may signal issues with sampling methods or dividend reinvestment strategies. Advanced analysis involves reviewing tracking error during both bull and bear markets to predict future behavior under 2026 conditions.
Liquidity
Liquidity encompasses average daily trading volume, bid-ask spreads, and assets under management. High liquidity reduces transaction costs and slippage during rebalancing. Prioritize ETFs with consistent volume above several million shares daily for seamless entry and exit. In 2026, liquidity metrics become particularly important during earnings seasons or macroeconomic announcements when trading volumes spike. Investors can assess liquidity by reviewing historical spread data and comparing it against similar ETFs in the same category to identify the most efficient vehicles for frequent trading.
Holdings Overlap
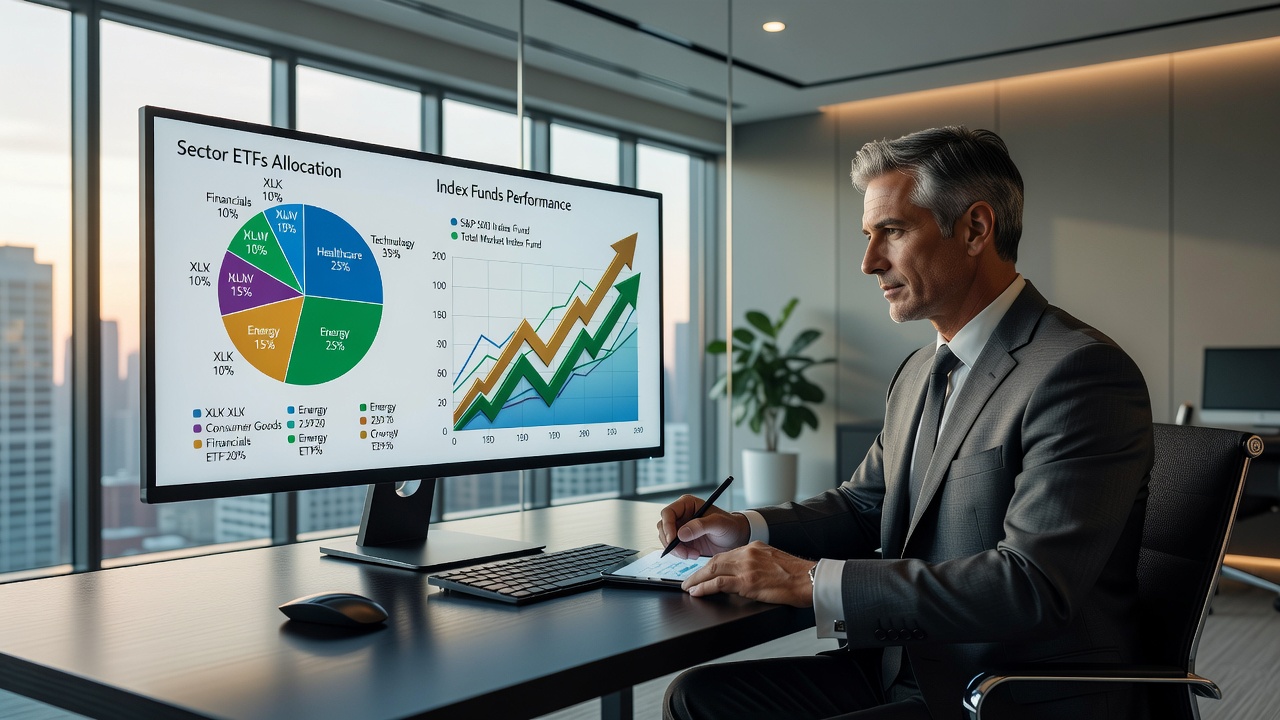
Holdings overlap occurs when sector ETFs and broad index funds share significant positions, potentially increasing concentration risk. Use overlap analysis tools to quantify shared holdings percentages and adjust allocations to maintain true diversification. A practical example involves comparing a technology sector ETF with a total market index fund, where overlap in mega-cap stocks like those in the Magnificent Seven could exceed 30%. This insight allows investors to tilt portfolios toward underrepresented areas such as small-cap or international equities for better balance.
Step-by-Step Analysis Framework
- Define your investment objectives and risk tolerance for 2026 conditions. Start by outlining goals such as capital appreciation, income generation, or inflation hedging, then quantify acceptable drawdowns based on personal financial circumstances.
- Collect data on target ETFs from multiple sources, including official filings. Gather prospectuses, fact sheets, and historical performance reports from provider websites and independent databases to ensure comprehensive coverage.
- Calculate or retrieve key metrics using standardized formulas. For tracking error, use return differentials over rolling 12-month windows; for liquidity, average the past 30 days of volume and spreads to smooth out anomalies.
- Compare metrics against peer ETFs and benchmarks. Create side-by-side tables highlighting strengths and weaknesses, focusing on how each metric performs relative to category averages.
- Assess overlap with existing holdings using correlation matrices. Tools that compute portfolio overlap percentages help reveal hidden concentrations that simple category labels might miss.
- Simulate portfolio impact through backtesting under various scenarios. Model outcomes for rising rates, recession, or growth environments expected in 2026 to test resilience.
- Document findings and set re-evaluation triggers. Maintain a checklist of thresholds, such as expense ratio increases above 0.15% or tracking error spikes, that prompt immediate review.
Comparing Popular ETF Options
When evaluating options, investors benefit from structured comparisons. Broad market index ETFs generally offer the lowest costs and tightest tracking, while sector-specific funds provide targeted exposure at the expense of higher fees and greater tracking deviations. International ETFs add geographic diversification but introduce currency and geopolitical risks that require careful liquidity assessment. A detailed table helps visualize these trade-offs for informed selection.
| ETF Category | Expense Ratio Range | Avg. Tracking Error | Liquidity Indicators |
|---|---|---|---|
| Broad Market Index | 0.03% – 0.10% | 0.05% – 0.15% | High volume, tight spreads |
| Sector-Specific | 0.10% – 0.35% | 0.20% – 0.60% | Variable by sector popularity |
| International | 0.15% – 0.40% | 0.30% – 0.80% | Moderate to high volume |
Real-World Portfolio Examples
Consider an investor allocating 60% to a broad market ETF and 40% to sector funds. Applying the framework reveals 25% holdings overlap in technology names, prompting a shift toward complementary international exposure for improved diversification in 2026. Another example involves a retiree-focused portfolio where liquidity analysis leads to replacing low-volume niche ETFs with highly traded alternatives, reducing potential costs during required minimum distributions. A third scenario shows how quarterly overlap reviews help a growth-oriented investor avoid overexposure to overlapping healthcare holdings amid regulatory changes.
Practical Checklists
- Verify latest metric updates within the past quarter.
- Review bid-ask spreads during market hours.
- Cross-reference holdings with major index constituents.
- Stress-test tracking error during high-volatility periods.
- Confirm alignment with overall asset allocation targets.
- Evaluate currency hedging costs for international ETFs.
- Analyze securities lending practices for hidden revenue offsets.
- Monitor premium or discount to net asset value trends.
Common Pitfalls to Avoid
Investors often overlook liquidity during calm markets only to face wide spreads in stress events. Another frequent error is ignoring overlap, which can lead to unintended sector bets. Always validate data across multiple platforms rather than relying on single-provider summaries. Failing to account for tax efficiency or dividend distributions can also erode returns, particularly when rebalancing occurs near year-end. In 2026, neglecting to model scenario-based impacts on tracking error may result in unexpected underperformance relative to benchmarks.
Advanced Techniques for 2026 Market Conditions
Beyond basic metrics, incorporate factor analysis such as value, momentum, and quality tilts within ETFs. Use multi-factor models to predict how combinations of metrics interact under inflation or rate-hike scenarios. Portfolio optimization software can run Monte Carlo simulations incorporating 2026-specific variables like supply chain disruptions. These methods elevate evaluation from reactive to proactive, ensuring portfolios adapt dynamically.
Frequently Asked Questions
How often should I re-evaluate ETF metrics?
Conduct full reviews quarterly, with monthly spot checks on liquidity and tracking error during periods of elevated market activity.
What role does holdings overlap play in risk management?
Excessive overlap amplifies sector-specific risks, reducing the benefits of diversification and potentially increasing portfolio volatility.
Can high liquidity compensate for a slightly higher expense ratio?
In active trading strategies, yes, because reduced transaction costs from tight spreads may outweigh modest fee differences over time.
How do 2026 economic forecasts influence metric priorities?
Expectations of moderate growth and persistent inflation shift emphasis toward low tracking error in commodity-linked ETFs and strong liquidity in defensive sectors.
Conclusion
Applying rigorous analysis to ETF metrics positions your portfolio for success in 2026. By integrating expense ratios, tracking error, liquidity, and holdings overlap into a structured process, you gain clarity and control over investment outcomes. Start implementing the framework today to refine your approach with confidence. Continuous education and periodic adjustments will sustain performance as market conditions evolve.
For additional regulatory context, consult resources from the U.S. Securities and Exchange Commission and detailed fund data from Morningstar. Further industry insights are available via the Investment Company Institute.

No comments yet. Be the first!