 Bullish Portfolio
Introduction to Data-Driven ETF Screening
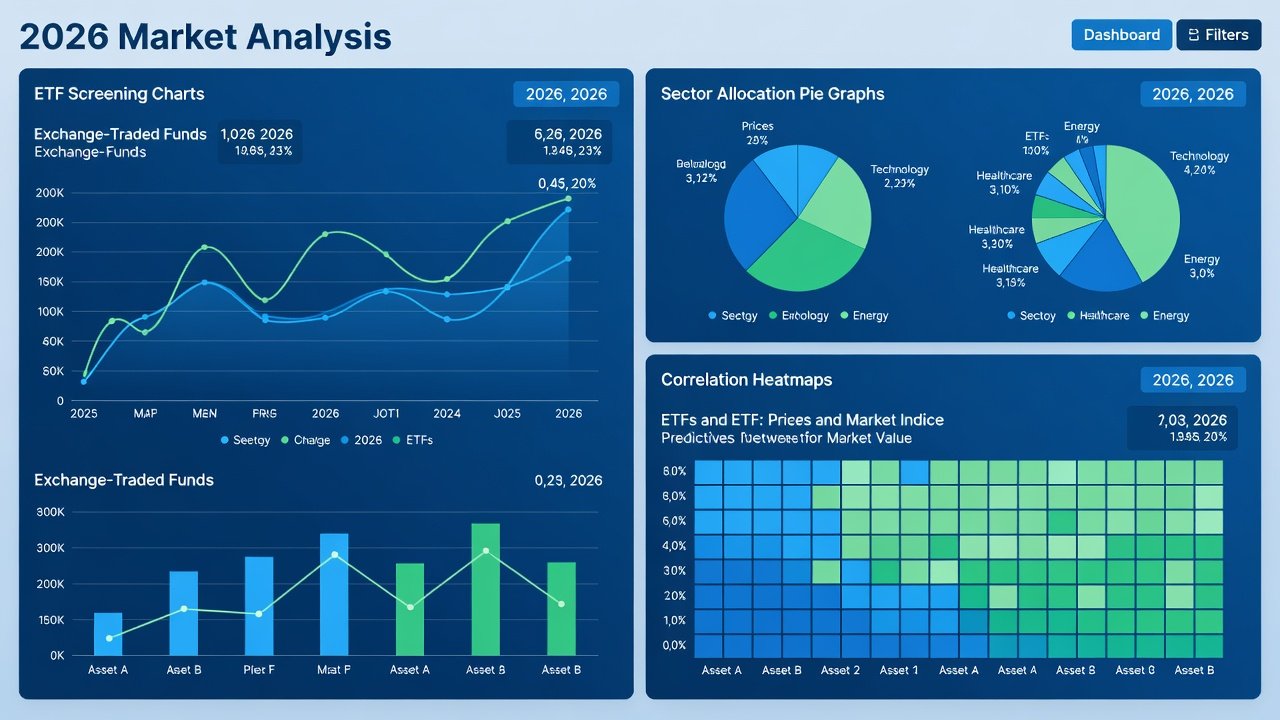
In the evolving landscape of 2026 financial markets, data-driven ETF screening has become essential for constructing balanced portfolios that combine sector-specific ETFs with foundational index funds. This approach moves beyond gut feelings or simple performance chasing by relying on quantitative analysis to uncover efficient blends. Investors can evaluate thousands of options using objective criteria, leading to better risk-adjusted returns and reduced overlap in holdings. The strategy proves especially valuable amid shifting economic conditions, where sector rotations in areas like technology, healthcare, and energy require careful monitoring.
By extending proven screening methods, this guide focuses on integrating free public databases with advanced premium platforms. The result is a systematic process that highlights metrics such as expense ratios, liquidity measures, correlation statistics, and detailed sector overlap reports. Whether you are a beginner building your first core-satellite portfolio or an experienced allocator refining existing positions, these techniques provide actionable insights for 2026 and beyond.
Key Metrics for Effective Evaluation
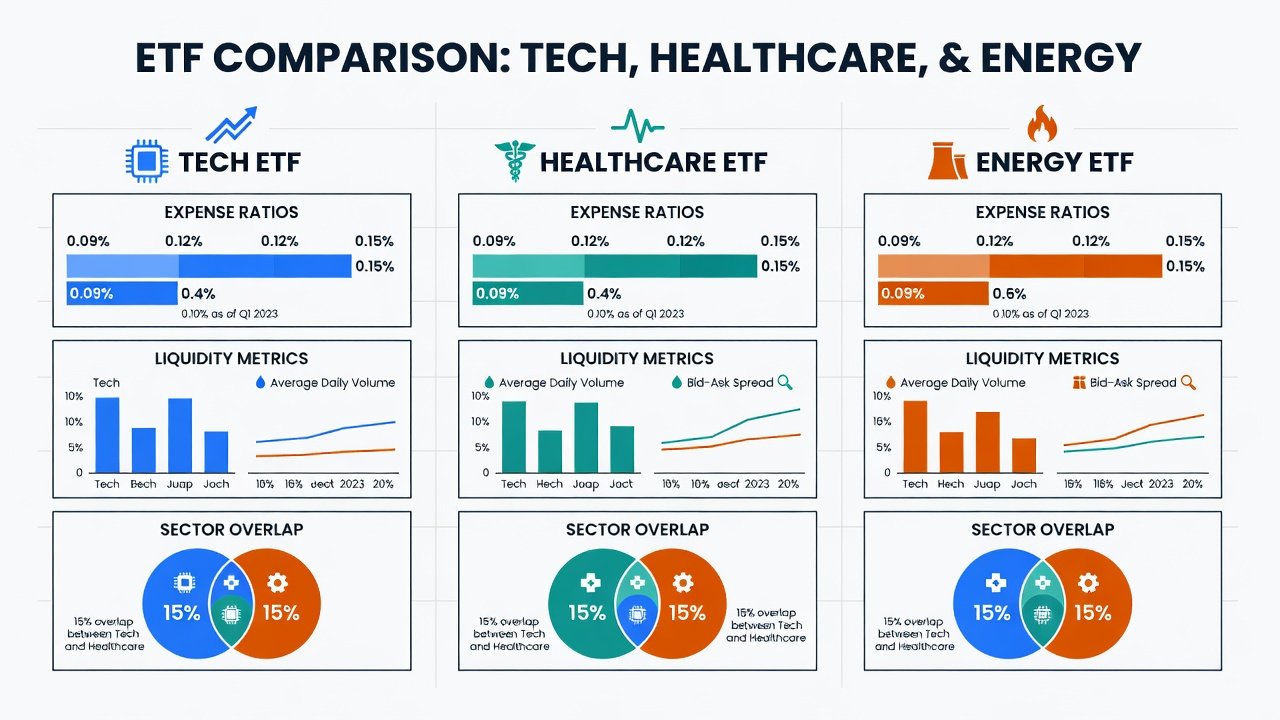
Effective ETF screening starts with mastering core quantitative metrics that reveal true value and compatibility. Expense ratios represent ongoing costs that compound over time, making lower ratios preferable for long-term holdings. Liquidity metrics, including average daily trading volume and typical bid-ask spreads, determine how easily positions can be entered or exited without significant price impact. Correlation coefficients measure how closely an ETF tracks or diverges from your core index holdings, helping ensure genuine diversification.
Sector overlap analysis examines underlying holdings to identify unintended concentrations in the same companies or industries. Additional important indicators include tracking error relative to benchmarks, consistency of dividend distributions, and growth trends in assets under management. Together these data points create a comprehensive filter that eliminates weak candidates early. For example, an ETF with high correlation to your existing S&P 500 index fund may add little new value despite attractive headline returns.
Free and Premium Screening Tools
Investors benefit from a mix of accessible free resources and feature-rich premium platforms. Free options include official regulatory databases that provide raw holdings data, expense details, and historical performance records. These sources allow basic filtering without subscription fees. Premium tools add layers such as customizable dashboards, real-time correlation matrices, scenario stress testing, and export functions for deeper modeling in external software.
Comparing the two categories reveals clear trade-offs: free tools deliver reliable foundational data suitable for initial screens, while premium services accelerate advanced analysis through automation and visualization. Many users begin with free portals to narrow candidates before upgrading for final validation.
Authoritative regulatory information is available directly from the U.S. Securities and Exchange Commission, which maintains comprehensive ETF filings and disclosures.
Step-by-Step Screening Examples
Begin your screening process by clearly defining portfolio objectives and risk tolerance. Establish a core allocation to broad-market index funds, then identify complementary sector ETFs that fill gaps without excessive duplication. Apply initial filters for expense ratios and minimum liquidity thresholds, followed by correlation scans spanning multiple time horizons.
- Define your investment universe and target risk parameters.
- Screen for sector ETFs meeting liquidity and cost criteria.
- Run overlap and correlation reports against core holdings.
- Simulate historical performance of proposed blends.
- Validate results with forward-looking stress tests.
One practical example involves screening for a healthcare sector ETF that exhibits moderate correlation to a core total-market index fund. After confirming low holdings overlap in top positions, the blend can be tested across different market regimes to confirm resilience.
Sector Overlap and Correlation Analysis
Overlap analysis prevents the common problem of holding multiple ETFs that essentially replicate the same exposures. Modern screening platforms generate visual breakdowns of shared holdings, highlighting concentrations in mega-cap names that can dominate both sector and index products. Correlation analysis extends this by quantifying relationships across rolling periods, allowing investors to adjust weights when correlations spike during stress events.
In 2026 market conditions, particular attention should be paid to how energy and technology sectors interact with broader indexes during inflation shifts or policy changes. Regular updates to these analyses help maintain diversification benefits over time.
Allocation Models for Different Risk Profiles
Conservative investors typically emphasize stability by allocating the majority of capital to core index funds while using defensive sectors such as healthcare and utilities for modest satellite exposure. Moderate profiles balance growth and preservation through roughly equal weighting between core holdings and a diversified set of sector ETFs. Aggressive strategies increase sector tilts toward higher-growth areas like technology and emerging energy themes, accepting greater volatility in pursuit of enhanced returns.
Regardless of profile, quarterly rebalancing based on updated correlation and overlap data keeps the portfolio aligned with original intent. These models can be customized further by incorporating personal factors such as time horizon and income needs.
Comparing Top Screening Platforms
Leading platforms vary significantly in data granularity, user experience, and analytical depth. Some excel at free basic screening with clean interfaces ideal for newcomers, while others deliver institutional-level features including multi-factor scoring and automated alerts. Advanced users often combine outputs from several platforms to cross-verify findings before committing capital.
Key evaluation criteria include export flexibility for custom analysis, quality of visualization tools, and coverage breadth across global and domestic ETFs. Selecting the right combination of tools streamlines the entire screening workflow.
Identifying Undervalued Opportunities in Tech, Healthcare, and Energy
Within technology, focus on ETFs that capture innovation themes while maintaining reasonable valuations relative to earnings trajectories. Healthcare opportunities frequently appear in specialized sub-sectors where moderate correlations to broad indexes create attractive diversification. Energy blends can benefit from transition-related holdings when supported by strong liquidity metrics and favorable macroeconomic backdrops.
Practical identification steps include reviewing 30-day volume trends, comparing sub-sector performance dispersion, and cross-referencing with economic indicators. This layered approach helps surface opportunities that pure price screens might overlook.
Mistakes to Avoid in 2026 Market Conditions
Common pitfalls include over-weighting recent short-term performance without examining multi-year correlations and ignoring hidden holdings overlap across seemingly unrelated sectors. Another frequent error is neglecting liquidity during volatile periods, which can lead to unfavorable execution prices. Maintaining discipline around predefined screening criteria helps sidestep these issues.
FAQ
- How often should I re-screen my ETF blends? Conduct full reviews quarterly or immediately after significant market or regulatory developments.
- What free resources complement premium tools? Government regulatory portals and academic research repositories supply foundational data at no cost.
- How do I handle high correlation in proposed blends? Substitute holdings with lower-correlated alternatives or reduce sector allocation weights.
- Should overlap analysis consider only top ten holdings? Review full holdings lists, as concentrations can appear deeper in the portfolio.
- Is historical correlation sufficient for 2026 decisions? Combine historical data with forward scenario testing for more robust conclusions.
By applying these structured, data-driven techniques consistently, investors can build and maintain resilient 2026 portfolios that effectively blend sector opportunities with core index stability.


No comments yet. Be the first!