 Bullish Portfolio
Introduction to Technical Analysis for Bullish Opportunities
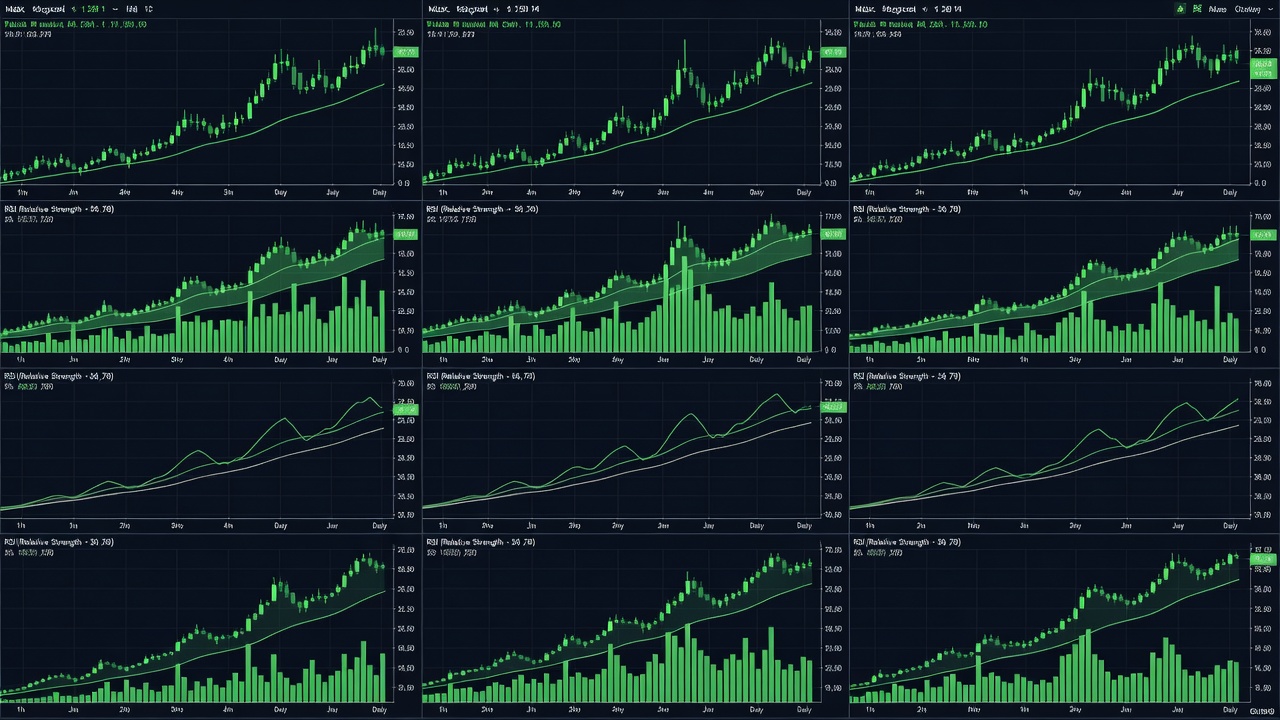
As we move into 2026, retail investors are actively seeking reliable methods to identify bullish stock picks amid evolving market conditions. Technical analysis offers a structured framework for interpreting price movements, trading volume, and momentum indicators to uncover growth opportunities in sectors such as renewable energy, artificial intelligence infrastructure, and advanced manufacturing. This approach emphasizes chart-based signals rather than solely relying on company earnings reports, allowing traders to time entries with greater precision during periods of upward momentum.
Unlike purely fundamental strategies, technical analysis reveals shifts in supply and demand through visual patterns and oscillator readings. Beginners benefit from starting with core concepts while intermediate users refine their skills by layering multiple confirmations. Throughout this guide, we explore actionable techniques that tie directly to screening bullish stocks for 2026, including practical examples and risk controls that help protect capital in volatile environments.
Essential Chart Patterns Signaling Bullish Trends
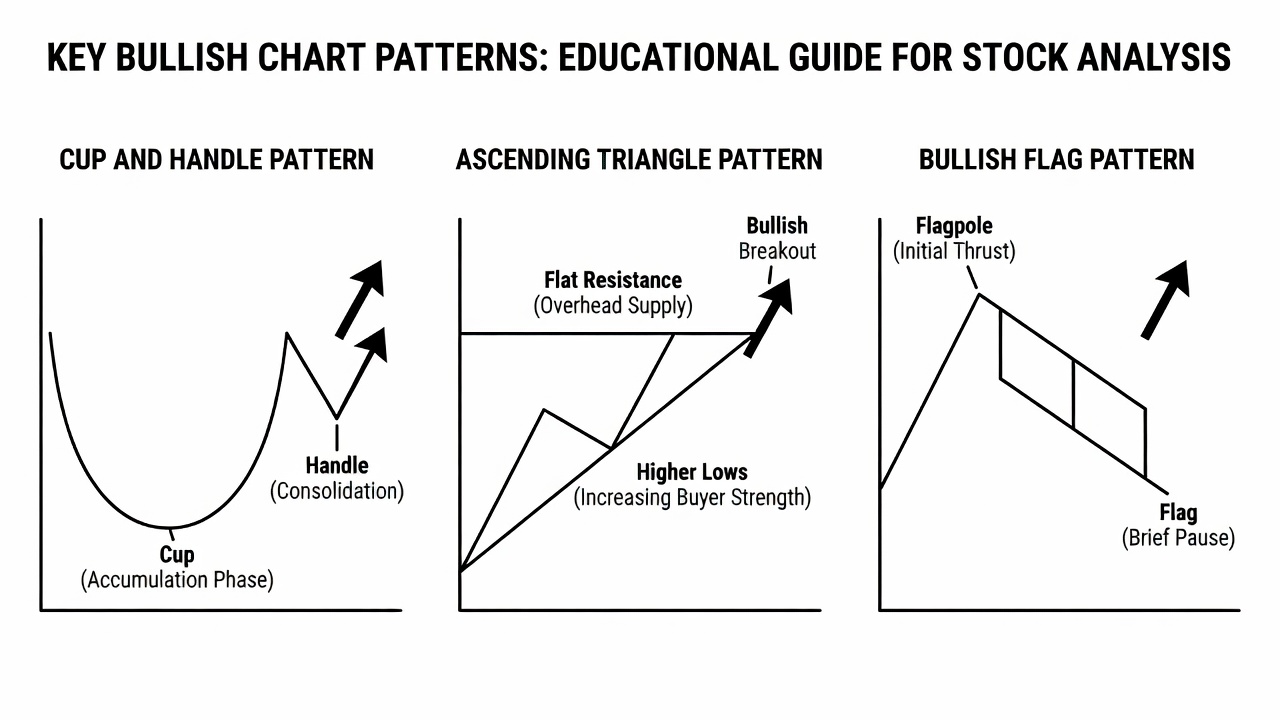
Bullish chart patterns provide visual roadmaps for potential breakouts. The cup and handle formation typically develops over several weeks, featuring a rounded bottom that represents accumulation followed by a smaller consolidation handle. Traders watch for a decisive close above the handle's resistance line accompanied by expanding volume. Ascending triangles form when price creates a series of higher lows against a horizontal resistance level, indicating persistent buying interest that often leads to upside resolution.
Bullish flags appear after sharp advances and consist of a brief parallel-channel pullback that resolves higher. These patterns perform best on daily and weekly timeframes when they occur within established uptrends in emerging sectors. To increase reliability, investors should measure the projected price target by adding the pattern's height to the breakout point. Combining these formations with supporting indicators reduces the frequency of false breakouts that can erode trading accounts.
Volume Indicators and Their Role in Confirming Strength
Volume serves as the fuel behind sustainable price advances. Rising volume during upward moves confirms institutional participation, while contracting volume on declines suggests limited selling conviction. The on-balance volume indicator accumulates volume on up days and subtracts it on down days, often diverging ahead of price to foreshadow trend continuation. Chaikin money flow adds another dimension by incorporating both price location within the daily range and volume to gauge accumulation or distribution pressure.
When screening for 2026 opportunities, prioritize stocks whose 20-day average volume exceeds the prior three-month average by at least 30 percent during breakout attempts. This filter helps eliminate thinly traded names susceptible to erratic swings. Monitoring volume trends across multiple sessions provides early warnings when momentum begins to fade, allowing timely exits before larger reversals develop.
Momentum Oscillators for Timing Bullish Entries
Momentum oscillators quantify the speed of price changes and highlight potential continuation or reversal points. The relative strength index measures recent gains against losses over a 14-period window; readings climbing above 50 from oversold territory often coincide with the early stages of bullish moves. The moving average convergence divergence histogram reveals shifts in trend strength when the MACD line crosses above its signal line, especially when this occurs below the zero line in recovering markets.
Stochastic oscillators add short-term timing precision by comparing closing prices to recent ranges. A bullish crossover in the %K and %D lines within the oversold zone frequently marks low-risk entry points. Applying these tools across weekly and daily charts creates confluence that filters out noise. For instance, a weekly RSI holding above 55 combined with a daily MACD bullish crossover has historically preceded extended rallies in technology and clean-energy equities during prior expansion cycles.
Real-World Examples from Emerging Sectors
Stocks in the electric vehicle battery supply chain and semiconductor equipment manufacturers have repeatedly displayed textbook technical setups. A representative name might form a multi-week cup and handle on the weekly chart while on-balance volume reaches new highs ahead of price. Traders who waited for volume-supported breakouts above resistance captured extended advances as sector tailwinds strengthened. Similar patterns appeared in companies developing AI data-center infrastructure, where ascending triangles resolved higher after momentum oscillators confirmed building strength. These examples illustrate how technical signals align with fundamental growth narratives to produce high-probability trades when both disciplines are integrated.
Risk Management Rules for Sustainable Gains
Robust risk management separates consistent performers from those who experience large drawdowns. Define stop-loss orders just below the most recent swing low or pattern support to limit losses on any single position. Position sizing should ensure that a full stop-out represents no more than one to two percent of total portfolio equity. Trailing stops based on a multiple of average true range allow profits to run while protecting gains once price moves favorably.
Avoid the temptation to add to losing positions without fresh technical confirmation. Instead, maintain a written trading plan that specifies maximum daily loss limits and correlation checks across holdings. Regular review of trade journals helps identify recurring mistakes and reinforces disciplined execution over emotional decision-making.
Common Pitfalls to Avoid in Technical Screening
- Relying on a single indicator without requiring confluence from volume, multiple timeframes, and pattern structure, which increases the likelihood of whipsaw trades.
- Overlooking the broader market environment, including sector rotation, interest-rate shifts, or macroeconomic releases that can override individual stock signals.
- Entering breakouts immediately without waiting for volume expansion or oscillator confirmation, often resulting in premature entries that reverse quickly.
- Failing to cross-reference technical setups with fundamental growth metrics such as revenue expansion and margin improvement, leaving positions vulnerable to negative earnings surprises.
- Neglecting to adjust position sizes during periods of elevated market volatility, which amplifies drawdowns when trends temporarily stall.
Step-by-Step Checklist for Screening Top Stocks in 2026
- Begin with a sector scan focused on industries demonstrating structural growth drivers and above-average relative strength versus the broader market.
- Apply volume filters requiring recent average daily volume to exceed the three-month norm during any consolidation or breakout phase.
- Identify high-probability chart patterns such as cups with handles or ascending triangles on weekly charts, then drill down to daily charts for precise entry timing.
- Confirm momentum with RSI readings above 50 and positive MACD histogram values, ensuring alignment across at least two timeframes.
- Verify on-balance volume or Chaikin money flow is making new highs in tandem with price to confirm institutional support.
- Establish risk parameters including stop-loss placement, position size limits, and profit targets derived from pattern measurements.
- Cross-check fundamental metrics including year-over-year revenue growth and earnings trajectory to ensure technical signals rest on solid business foundations.
- Execute entries only on confirmed breakouts accompanied by expanding volume and monitor positions daily for any deterioration in technical structure.
Combining Technical Signals with Fundamental Growth Metrics
Technical analysis delivers superior timing, yet pairing it with fundamental data creates a more durable investment process. Seek companies posting accelerating revenue in innovative fields while simultaneously exhibiting the chart patterns and volume profiles described above. This dual filter reduces exposure to names that may appear technically attractive but lack underlying business momentum. Authoritative resources such as Investopedia offer detailed indicator tutorials, while SEC filings supply the raw financial statements needed for verification. Additional market context is available through NYSE and Nasdaq educational sections.
Frequently Asked Questions
How reliable are technical patterns during periods of elevated volatility?
Patterns become more dependable when supported by volume expansion and oscillator confirmation, yet no methodology guarantees results. Strict adherence to predefined risk rules remains essential regardless of market conditions.
Can beginners implement these techniques without extensive prior experience?
Yes. Starting with pattern recognition and basic oscillator interpretation builds competence rapidly. Paper trading recommended setups for several weeks allows skill development before risking real capital.
Should technical analysis entirely replace fundamental research?
No. The most robust outcomes arise when technical signals guide entry timing while fundamentals validate the long-term growth thesis, creating a balanced and repeatable process.
What timeframes work best for screening bullish stocks heading into 2026?
Weekly charts reveal the primary trend and major patterns, while daily charts provide precise entry triggers. Combining both timeframes minimizes false signals and improves overall trade quality.
Conclusion
Mastering technical analysis equips retail investors with practical tools for locating bullish stock picks in 2026. By focusing on proven chart patterns, volume confirmation, and momentum oscillators while enforcing disciplined risk management, traders can navigate emerging growth opportunities with greater consistency. Apply the screening checklist consistently, integrate fundamental context, and refine your approach through ongoing market observation to build lasting proficiency.

No comments yet. Be the first!