 Bullish Portfolio

Introduction to Personalized Compounding Models for Financial Independence
Building a custom compounding calculator empowers individuals pursuing financial independence (FI) to project wealth growth accurately through 2026 and beyond. Unlike generic online tools, DIY spreadsheets allow precise tailoring of variables such as contribution rates, expected returns, and inflation adjustments. This approach supports realistic planning by incorporating personal circumstances and market variables that generic calculators often overlook. Compound interest serves as the engine of long-term wealth building, turning consistent contributions into substantial portfolios over decades. The core formula A = P(1 + r/n)^(nt) forms the starting point, but effective FI models extend this with dynamic elements like variable contributions, tax considerations, and inflation to reflect true purchasing power at retirement.
Many aspiring FI practitioners rely on basic online estimators that fail to account for individual risk tolerance or changing life events. A personalized spreadsheet bridges this gap by enabling scenario planning that aligns with specific goals, such as achieving a 4% safe withdrawal rate or reaching the classic 25x annual expenses milestone. This guide walks through every component needed to construct a robust tool tailored for 2026 projections.
Selecting Key Variables for Your 2026 Calculator
Effective models begin with core inputs that drive accuracy. Begin by defining the initial portfolio value, which represents current savings and investments. Next, establish contribution rates, including monthly or annual additions from salary, side income, or windfalls. Expected annual return rates typically range from 6% to 10% for diversified stock and bond portfolios, though users should select conservative figures based on historical averages adjusted for current market conditions. Inflation adjustments are essential, commonly set between 2% and 3% to maintain realistic future value estimates.
Additional variables enhance depth. Incorporate expected salary growth rates of 3% to 5% annually, changes in living expenses, and potential tax drag on returns. For advanced users, include fields for dividend reinvestment rates and management fee percentages. These selections prevent the model from producing overly optimistic or pessimistic outcomes. List key variables clearly in your spreadsheet with dedicated input cells that feed into all calculations, allowing quick sensitivity testing when assumptions change.
- Contribution rate: Factor in raises, bonuses, or side income increases over time.
- Expected returns: Segment by asset class for more granular modeling.
- Inflation adjustments: Apply separately to contributions and final portfolio values.
- Withdrawal phase: Add post-FI spending rates and sequence of returns risk.
Implementing Compound Interest Formulas in Spreadsheets
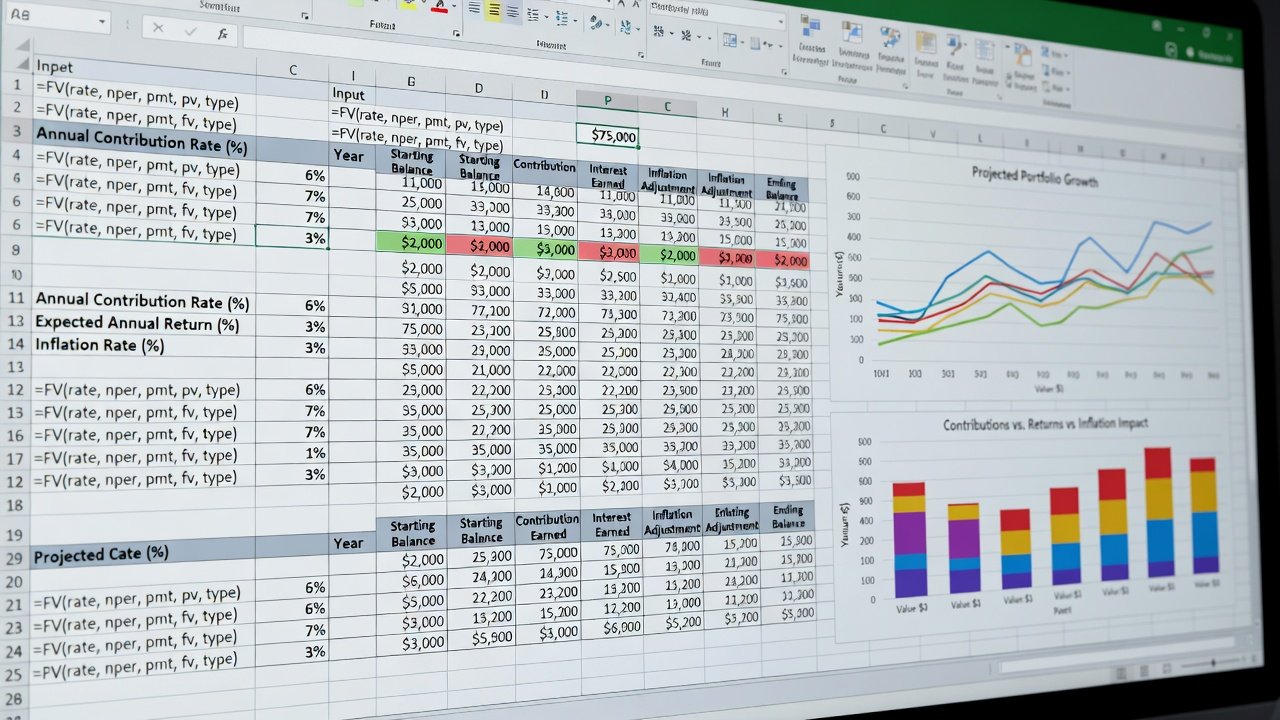
Spreadsheet platforms such as Excel or Google Sheets provide the ideal environment for these calculators. Structure the sheet with columns for year number, starting balance, annual contribution, growth amount, inflation impact, and ending balance. The FV function simplifies projections: =FV(rate, nper, pmt, pv, type). For multi-year models, replicate rows and reference prior ending balances as the new present value. Incorporate inflation by adjusting the real return rate using the formula (1 + nominal return) / (1 + inflation) - 1.
Build step-by-step: First create input cells at the top for easy modification. Then add a timeline starting from the current year through 2030 or later. Use absolute references for rates and relative references for balances. Test the setup with small datasets before scaling to full projections. This methodical construction minimizes formula errors and supports easy updates as new data emerges.
Real-World Examples and Sample Data Sets
Consider a 35-year-old professional with a $75,000 starting portfolio aiming for FI in 15 years. Inputs include $2,000 monthly contributions growing at 4% annually, an 8% expected return, and 2.5% inflation. The model projects crossing the FI threshold by age 50, with detailed year-by-year breakdowns showing the accelerating effect of compounding after year eight. A second example compares two paths: one with aggressive 10% returns and steady contributions versus a conservative 6% return with higher initial savings. The aggressive path reaches FI three years earlier but carries higher volatility risk.
Third example incorporates a career break: reduce contributions to zero for two years then resume. The spreadsheet reveals the long-term impact remains manageable if the portfolio has already grown substantially, demonstrating the resilience of early compounding. These examples illustrate how small changes in inputs produce dramatically different timelines, underscoring the value of customization over one-size-fits-all tools.
Manual Tracking Versus Automated Methods
Manual spreadsheet maintenance grants complete control over every assumption and formula but demands ongoing discipline for data entry and updates. Automated solutions from robo-advisors or portfolio trackers offer seamless syncing yet restrict customization of variables like personal inflation forecasts. A hybrid strategy often delivers the best results: maintain the core projection engine in a spreadsheet while using automation for importing transaction history and current balances. This combination reduces errors while preserving analytical flexibility essential for 2026 FI planning.
Integrating Brokerage Data Feeds
Connect brokerage accounts by exporting CSV files monthly or using API connections where available from major providers. Import balances, contribution history, and dividend data directly into dedicated tabs that feed the main projection sheet. This integration keeps projections current without repetitive manual updates. Always verify imported data for accuracy and maintain separate backup copies of the spreadsheet. Security best practices include using read-only API keys and avoiding storage of login credentials within the file itself.
Explore foundational investment education at Investopedia. Additional economic data references are available through Federal Reserve resources.
Stress-Testing Scenarios for Different FI Timelines
Create multiple scenario tabs to evaluate resilience. Base case uses median assumptions, while bear case applies 5% returns and 4% inflation. Bull case tests 10% returns with lower contributions. Include market crash simulations by inserting a one-time 25% portfolio drop at various points in the timeline. These tests reveal critical insights, such as the need to extend the working years by two to four years under adverse conditions or accelerate savings during strong market periods.
Further refine with sequence-of-returns analysis by modeling different withdrawal start dates. This prevents over-reliance on average returns and prepares users for real market unpredictability.
Optimization Strategies and Common Pitfalls
Maximize results by reviewing the model quarterly and adjusting contribution rates upward whenever possible. Minimize drag from high fees by modeling their cumulative effect over decades. Avoid common pitfalls such as ignoring taxes on taxable accounts, underestimating healthcare costs in early retirement, or failing to update inflation assumptions as economic conditions evolve. Regular audits of the spreadsheet formulas prevent small errors from compounding into major projection inaccuracies.
Reference comprehensive portfolio analysis tools at Morningstar for additional validation of return assumptions.
Conclusion
Custom compounding calculators deliver unmatched clarity for achieving financial independence by 2026 or later. Through careful variable selection, rigorous formula implementation, and thorough stress testing, users gain a reliable roadmap that adapts to changing circumstances.
FAQ: Common Calculation Pitfalls and Optimization Tips
What is the biggest mistake in compounding projections? Relying solely on historical average returns without stress-testing leads to disappointment. Always model multiple economic environments and update inputs regularly.
How frequently should the calculator be updated? Review and refresh data at least quarterly or after major life or market events to maintain relevance.
Should taxes be modeled separately? Yes, create distinct sections for taxable, tax-advantaged, and Roth accounts to produce accurate after-tax projections.
What tools complement spreadsheet models? Combine with net worth trackers and budgeting apps for comprehensive oversight while keeping the compounding engine centralized.
How to handle variable contribution amounts? Use stepped contribution schedules that increase with projected salary growth or decrease during planned sabbaticals.
No comments yet. Be the first!