 Bullish Portfolio
Fibonacci Retracements: 2026 Stock Trends Guide
Intermediate traders searching for effective stock market analysis tools in 2026 often turn to Fibonacci retracements. These technical indicators help identify potential support and resistance levels during market pullbacks, allowing for more informed entry and exit decisions in volatile conditions.
Understanding Fibonacci Ratios
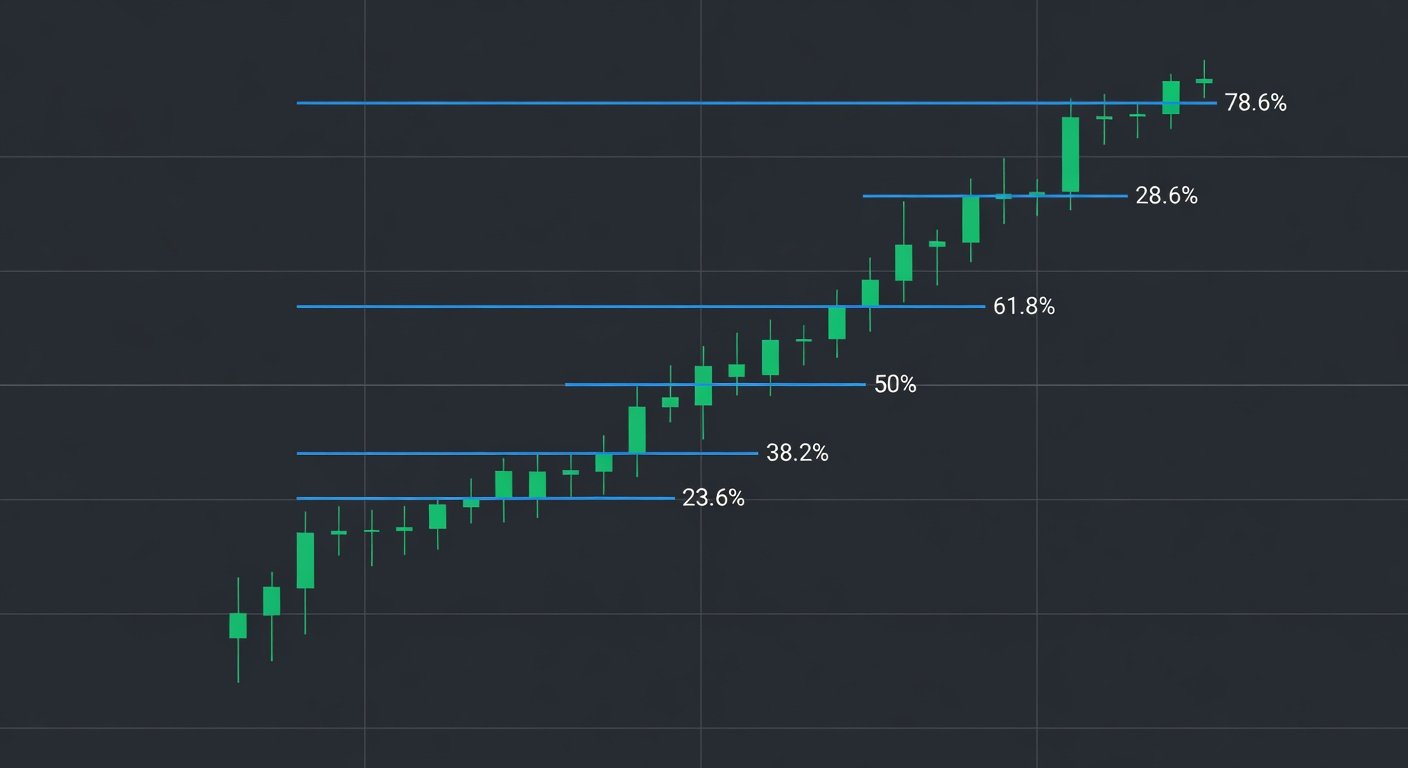
Fibonacci retracements are based on key ratios derived from the Fibonacci sequence: 23.6%, 38.2%, 50%, 61.8%, and 78.6%. The 61.8% level, known as the golden ratio, is particularly significant in trending markets. These percentages represent potential reversal points where price action may pause or reverse after an initial move.
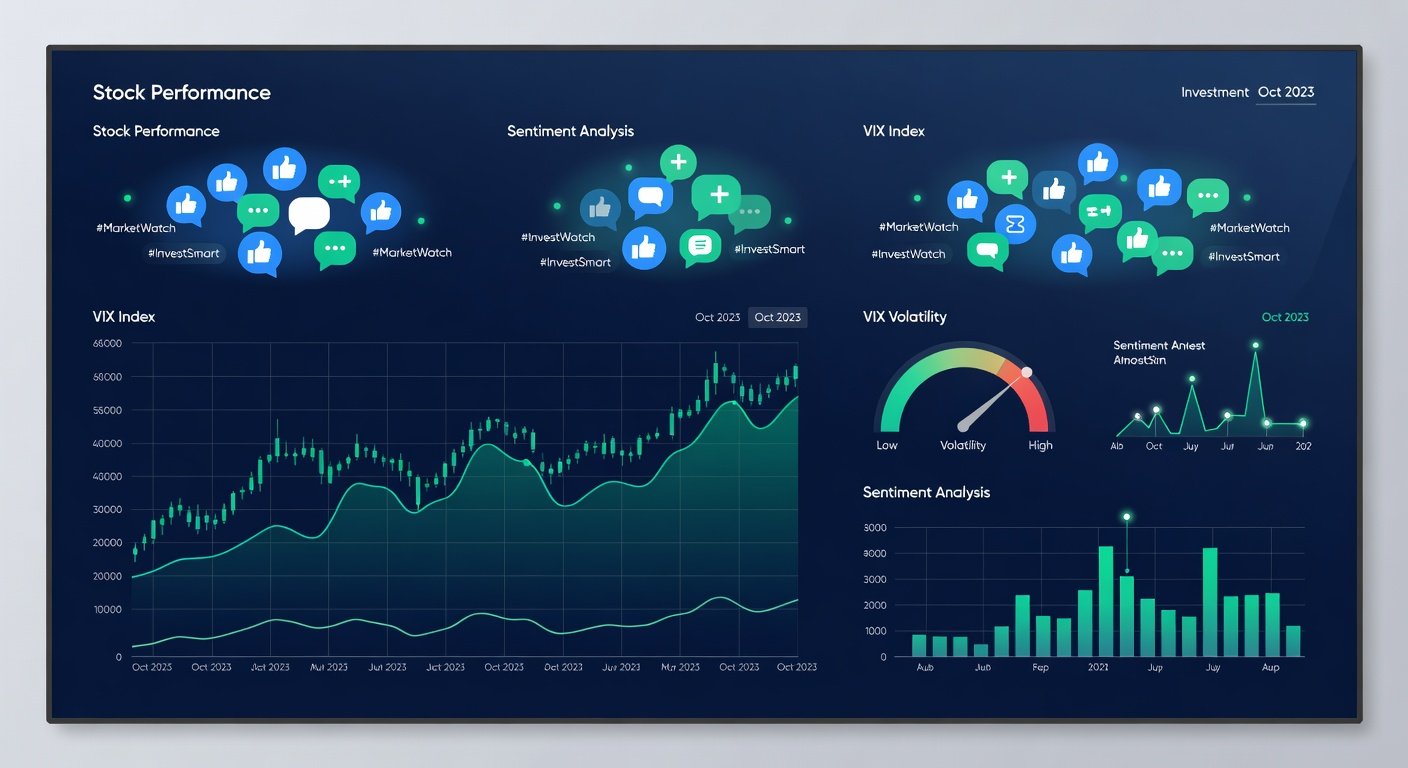
In 2026's dynamic environment, marked by tech sector fluctuations and macroeconomic shifts, these levels provide a mathematical framework for anticipating corrections without relying on subjective guesswork.
Step-by-Step Application on Uptrends and Downtrends
Applying Fibonacci retracements requires charting software such as TradingView or Thinkorswim. Start by identifying a clear swing high and swing low.
- For an uptrend: Select the lowest point of the move as the start and the highest point as the end. The retracement levels then project downward from the high.
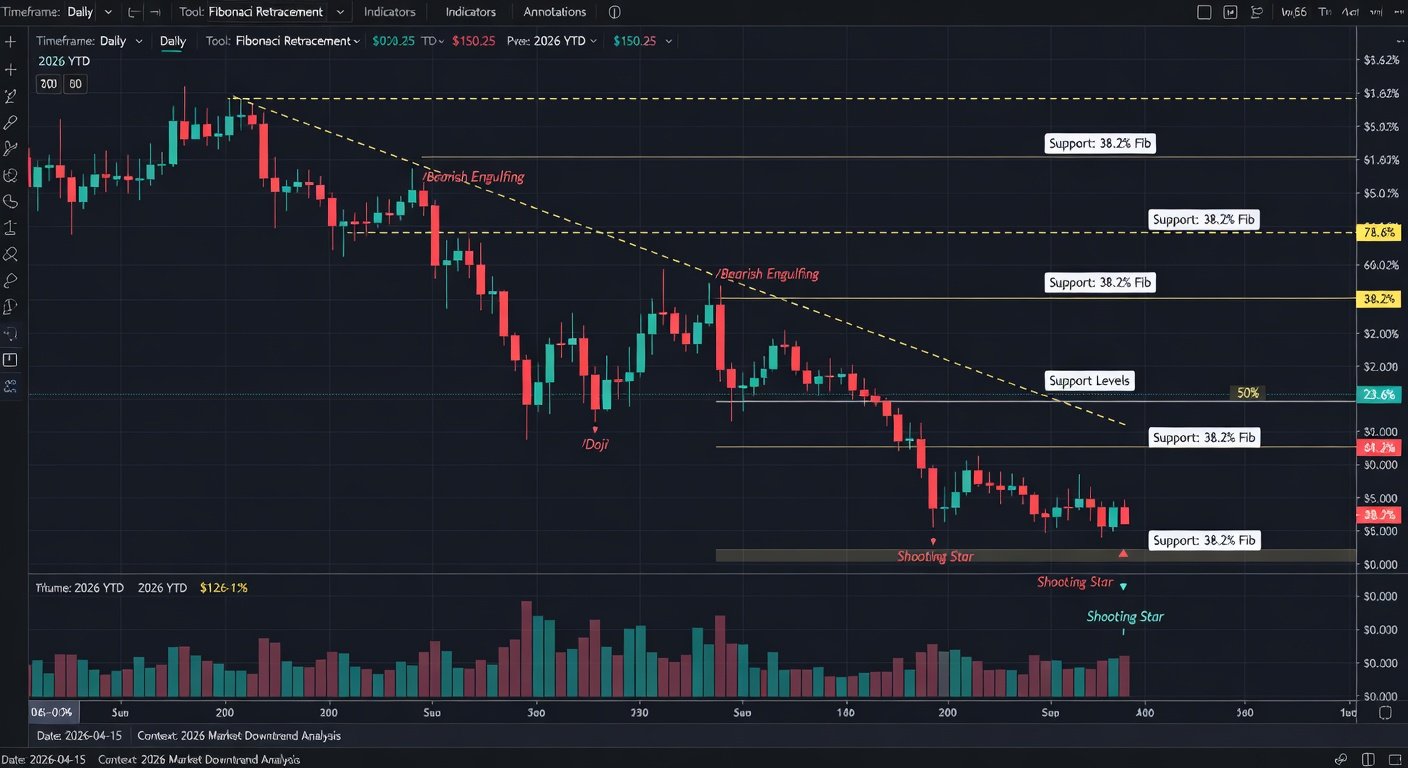
- For a downtrend: Anchor from the high to the low, projecting upward levels for potential bounces.
- Identify clear trend with swing points.
- Apply retracement tool accurately.
- Wait for volume and candle confirmation.
- Check multiple timeframes.
- Define risk parameters before entry.
Always draw the tool across the most recent significant impulse wave for accuracy. In practice, combine multiple timeframes to validate levels.
2026 Case Studies: Tech Stock Pullbacks
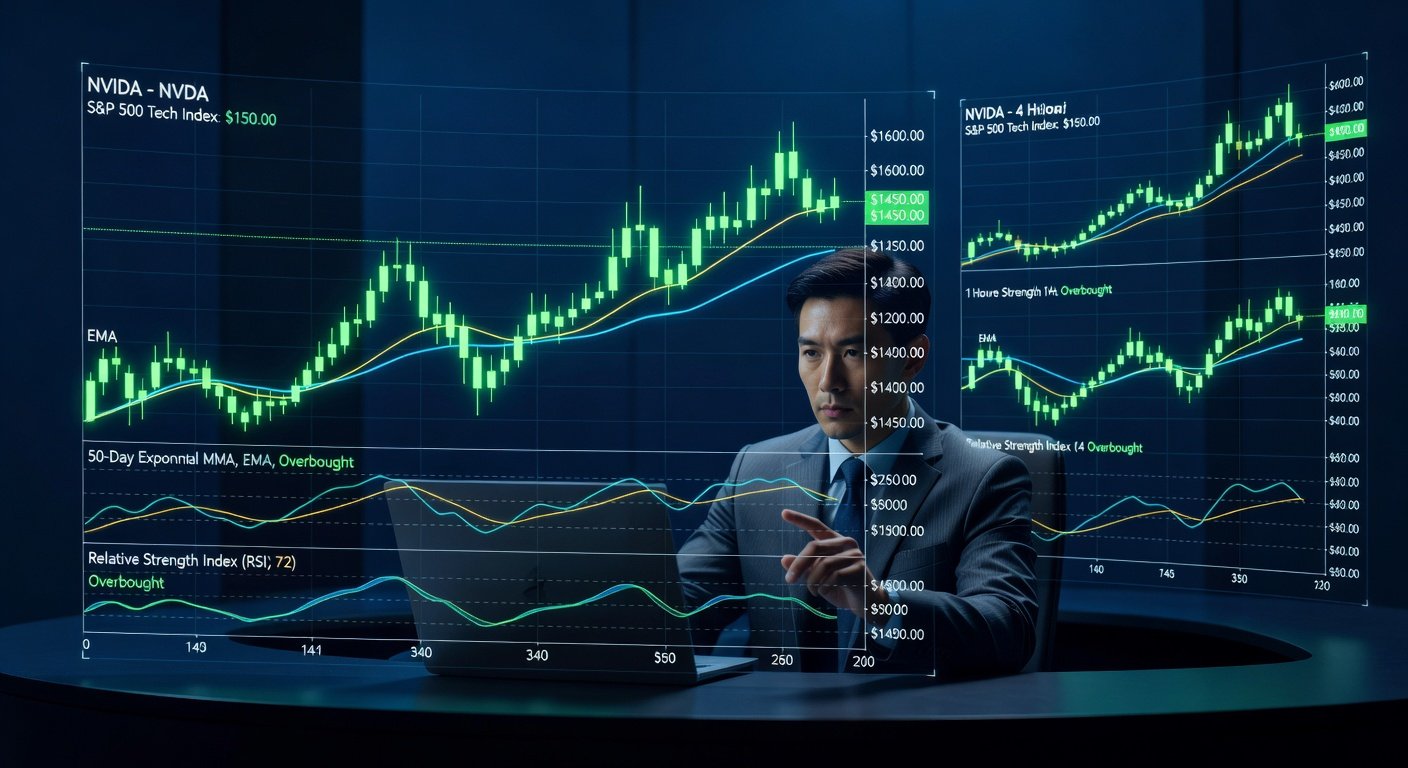
Consider a hypothetical 2026 scenario involving major tech stocks experiencing a 15% correction amid earnings season. Traders applying the 50% and 61.8% retracement levels on daily charts could pinpoint entry zones near historical support. Volume spikes at these levels often confirm institutional interest, while candlestick patterns like hammers provide additional signals.
Confirmation with Volume and Candles
Never trade Fibonacci levels in isolation. Confirm with rising volume on approach to a retracement zone and reversal candlesticks such as engulfing patterns. This multi-factor approach reduces false signals common in 2026's high-volatility sessions.
Common Pitfalls to Avoid
Over-reliance on single levels without context leads to losses. Avoid drawing retracements on choppy, non-trending charts. Ignoring broader market trends or news events can also invalidate setups. Always use stop-losses beyond the next Fibonacci level.
Advanced Extensions for Price Targets
Beyond retracements, Fibonacci extensions project targets in the direction of the trend using ratios like 161.8% and 261.8%. These help set profit objectives once a retracement bounce occurs, enhancing risk-reward ratios.
Practical Checklist for Traders
FAQs on Accuracy in Volatile Markets
How accurate are Fibonacci retracements in 2026 volatility? They work best as confluence tools rather than standalone predictors, with success rates improving when combined with other indicators.
Which ratio is most reliable? The 61.8% level often acts as strong support in bull markets.
For further reading on technical analysis foundations, visit Investopedia and Nasdaq.
No comments yet. Be the first!