 Bullish Portfolio

Introduction to Alternative Data in Technical Analysis
Traditional technical indicators like RSI, MACD, and volume provide valuable insights into market momentum and trends, but they often lag behind emerging signals. In 2026, traders are increasingly turning to alternative data sources such as satellite imagery, credit card transactions, and web scraping to gain an edge. These datasets allow analysts to detect shifts in consumer behavior, supply chain activity, and sentiment before they appear in price action. This evolution addresses limitations in conventional charting by layering real-world activity metrics onto established oscillators and momentum tools. By 2026, the integration of these sources has become essential for professionals seeking alpha in crowded markets where price action alone reveals incomplete pictures.
This approach combines quantitative rigor with unconventional inputs, creating more robust forecasting models. By integrating these sources with established tools, market participants can refine entry and exit points while reducing false signals. The result is a multi-dimensional view that anticipates reversals and continuations with higher probability.
Sourcing Alternative Data Effectively
Obtaining high-quality alternative data requires careful selection of providers and verification processes. Satellite imagery is commonly sourced from commercial operators tracking retail parking lots, shipping ports, and agricultural fields. Credit card transaction aggregates come from anonymized payment processors that compile spending patterns across sectors. Web scraping involves targeted extraction from e-commerce sites, job boards, and social platforms using ethical APIs where available.
Satellite Imagery Providers and Methods
Leading providers deliver daily or weekly captures of key locations such as warehouse complexes and store parking areas. Analysts filter for weather-adjusted images and apply computer vision models to count vehicles or measure activity levels. This data proves especially useful for retail and logistics stocks where physical presence correlates directly with revenue expectations.
Credit Card Transaction Aggregates
Payment processors offer aggregated, anonymized flows segmented by merchant category and geography. These feeds update daily or intraday and help validate demand trends ahead of official economic releases. Integration requires mapping categories to specific tickers for precise overlay on technical charts.
Web Scraping Techniques
Ethical scraping focuses on public product listings, review volumes, and job postings. Tools parse changes in pricing, inventory levels, and hiring activity to infer operational health. Always respect robots.txt files and rate limits to maintain sustainability.
Key considerations include data freshness, coverage breadth, and compliance with privacy regulations. Analysts should prioritize vendors offering audited datasets to minimize noise.
Integrating Alternative Data with RSI, MACD, and Volume
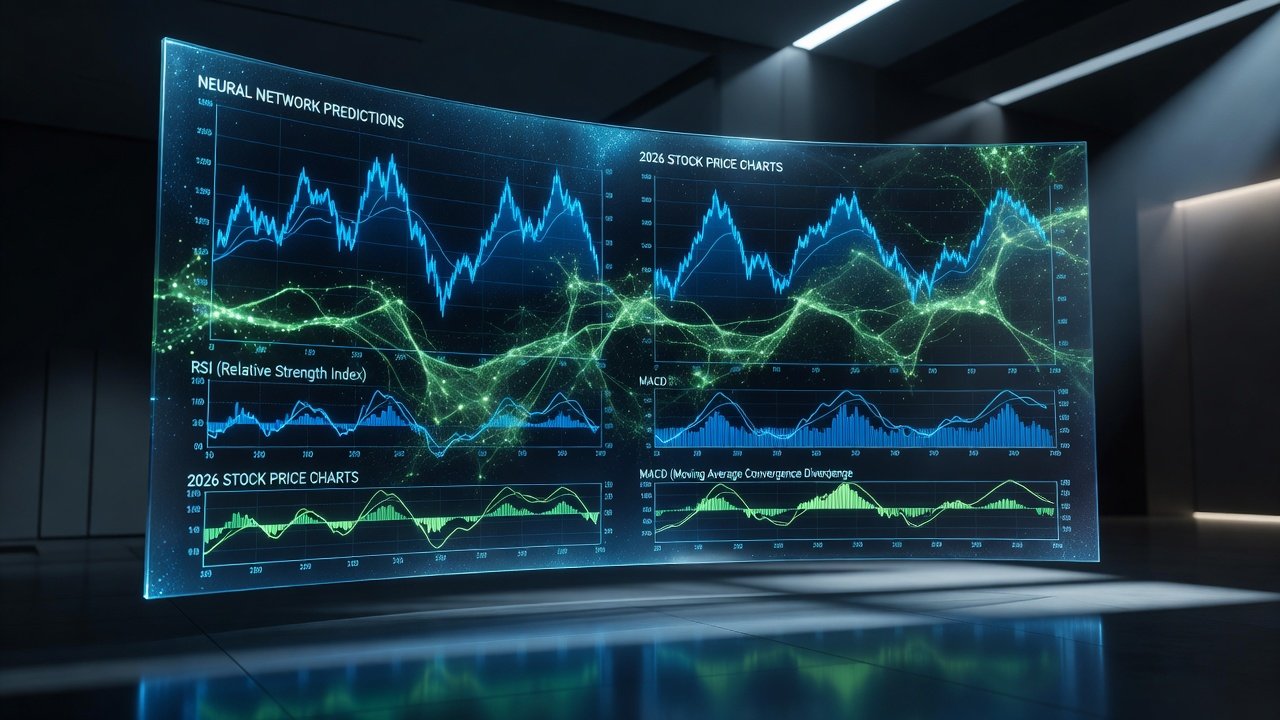
RSI measures overbought or oversold conditions, but pairing it with credit card spending surges in a sector can confirm genuine momentum shifts. MACD crossovers gain reliability when corroborated by satellite-derived foot traffic increases at major retailers. Volume spikes become more meaningful when web-scraped sentiment data shows rising online mentions of a company.
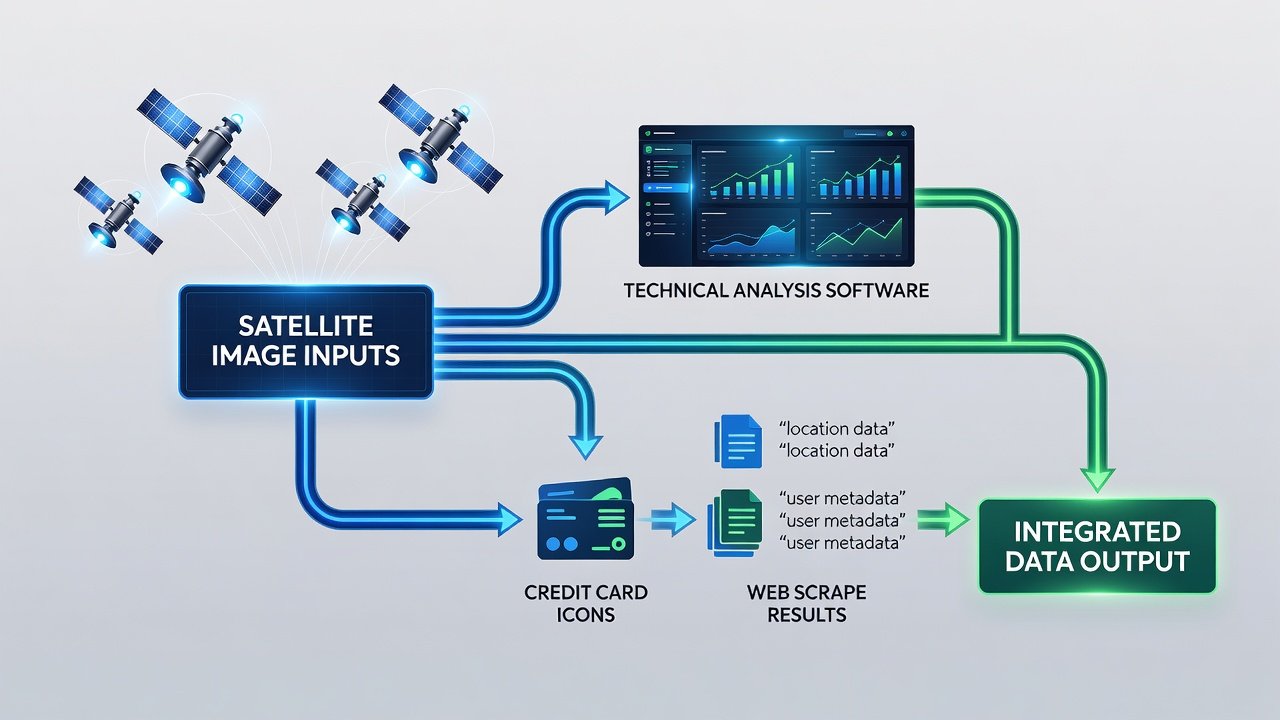
Integration typically occurs through normalized time-series alignment, where alternative signals are resampled to match daily or intraday price bars. This fusion reduces latency in trend detection and improves signal accuracy. For example, a rising RSI combined with increasing satellite counts at distribution centers can trigger earlier long positions than RSI alone. Traders often create composite scores that weight each data stream based on historical predictive power for specific assets.
Real-World Case Studies Demonstrating Improved Accuracy
One notable example involved a retail stock where satellite imagery revealed unexpected inventory buildups at distribution centers weeks before earnings. When combined with MACD divergence, this data helped predict a downward reversal with greater precision than volume alone. Another case in the consumer staples sector used credit card transaction flows to validate RSI breakouts, leading to earlier identification of sustained uptrends. A third study in the technology space applied web-scraped hiring data to anticipate volume surges ahead of product launches, resulting in more accurate timing of MACD signal line crosses.
These studies highlight how alternative inputs can front-run traditional indicators by days or even weeks, particularly in volatile sectors. Backtested results across multiple market regimes show reduced drawdowns when alternative signals filter conventional trades.
Comparing Data Quality and Latency Impacts
Satellite imagery often offers high spatial resolution but may suffer from cloud cover or processing delays of 24-48 hours. Credit card aggregates provide near-real-time updates with strong sector granularity yet can include seasonal biases. Web scraping delivers the lowest latency but risks incomplete coverage or regulatory hurdles.
Traders must weigh these trade-offs: high-latency data suits swing trading strategies, while low-latency feeds benefit high-frequency adjustments. Quality metrics such as correlation coefficients with price movements help quantify the added value of each source. Latency impacts are most pronounced during earnings seasons when rapid confirmation of trends determines profitability. Data quality comparisons also reveal that satellite sources excel in physical goods sectors while credit card data shines for consumer-facing companies.
Step-by-Step Workflow for Building an Alternative Data Pipeline
- Define target indicators and alternative signals aligned with your strategy, including specific RSI thresholds and MACD parameters.
- Select and onboard data vendors with clear licensing terms and audit trails.
- Establish secure ingestion pipelines using cloud storage and ETL tools for automated daily refreshes.
- Normalize and clean datasets for consistency with price feeds, handling missing values and outliers.
- Develop correlation models and backtest against historical RSI, MACD, and volume performance across bull, bear, and sideways markets.
- Implement real-time monitoring dashboards for ongoing validation and alert generation.
- Iterate based on out-of-sample results and regulatory updates to maintain robustness.
This structured process ensures scalability and minimizes integration errors while allowing for incremental improvements over time.
Challenges, Best Practices, and Risk Mitigation
Common challenges include data gaps during holidays, overfitting during backtesting, and shifting correlations as markets evolve. Best practices involve maintaining diversified data sources, conducting regular stress tests, and documenting all integration rules. Risk mitigation includes setting strict position sizing rules when alternative signals conflict with traditional indicators. Always maintain audit logs for compliance reviews.
Practical FAQs on Compliance and Tool Selection
How do I ensure compliance when using web scraping?
Always review terms of service and consult legal experts. Focus on publicly available data and respect rate limits. Resources like the SEC website provide guidance on fair disclosure practices.
What tools are recommended for data integration?
Popular platforms include Python libraries such as Pandas for processing and visualization tools like Tableau for overlaying signals. Choose solutions with strong API support for your chosen data providers.
Are there risks of data overfitting?
Yes. Rigorous cross-validation and walk-forward testing are essential to avoid curve-fitting when combining multiple datasets.
Which regulatory bodies oversee alternative data use?
Key organizations include the FTC for consumer data privacy and the CFTC for derivatives-related feeds. Review their guidelines before deployment.
How should latency be managed in live trading?
Implement tiered alerting systems that flag high-confidence signals only when multiple data streams align within acceptable time windows.
Conclusion
Alternative data strategies represent a powerful evolution in technical analysis for 2026. By thoughtfully sourcing satellite imagery, credit card transactions, and web scraping feeds and integrating them with RSI, MACD, and volume, traders can uncover hidden trends earlier and with greater confidence. Following a disciplined workflow, addressing compliance, and mitigating risks ensures sustainable results in competitive markets. As these techniques mature, they will continue to separate leading analysts from the broader market.
No comments yet. Be the first!