 Bullish Portfolio
Introduction to AI-Enhanced Order Flow in 2026 Markets
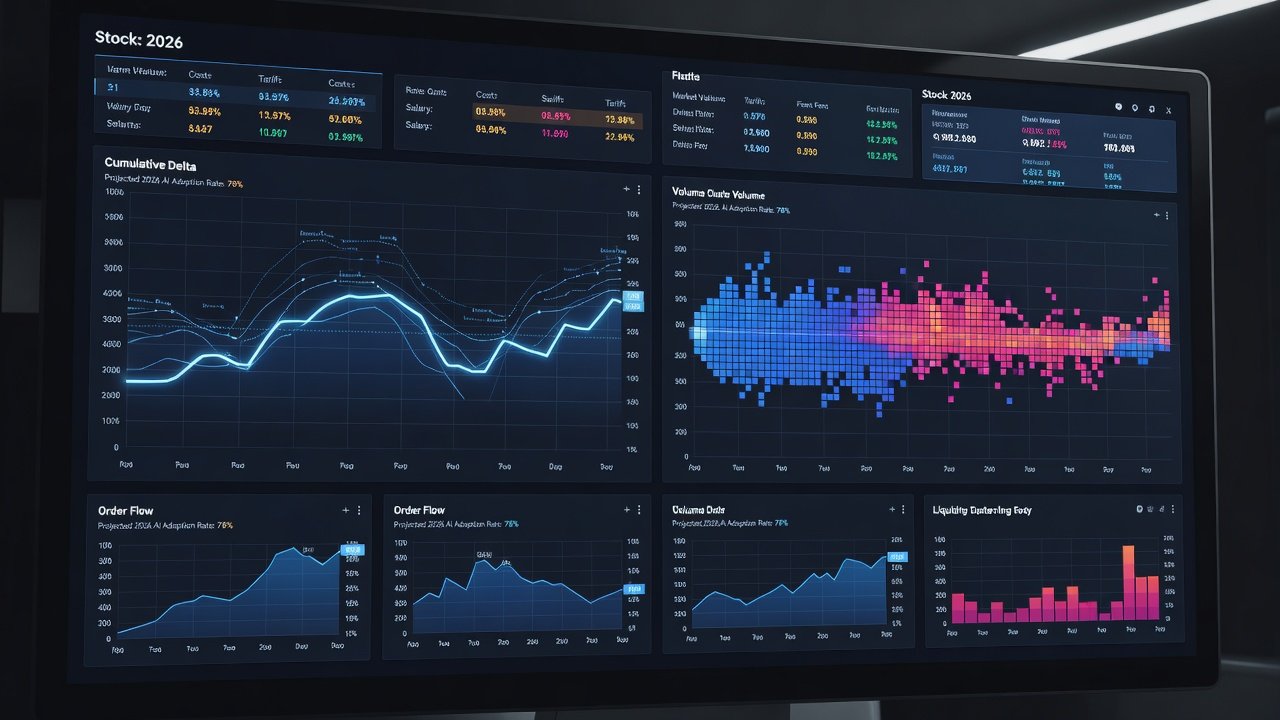
In the volatile landscape of 2026, advanced traders are turning to AI-driven order flow analysis to gain an edge over traditional methods. By combining machine learning with established tools like cumulative delta and volume clusters, investors can better detect institutional moves and validate emerging trends across equities, futures, and options. This approach integrates real-time data feeds with technical indicators such as RSI to provide actionable signals in fast-moving sectors including technology, healthcare, and energy. Order flow analysis has long helped traders understand buying and selling pressure at the micro level by examining the tape and transaction data. With AI augmentation, the process becomes faster, more scalable, and predictive, allowing for quicker identification of absorption patterns that signal reversals or continuations before they become obvious on standard charts.
The 2026 market environment features heightened volatility driven by geopolitical events, earnings seasons, and rapid sector rotations. Traders who rely solely on price action or lagging indicators often miss the footprints left by large institutions. AI models excel at processing vast volumes of tick data to uncover hidden relationships, making them essential for those seeking consistent edges in uncertain conditions.
Core Concepts: Cumulative Delta and Volume Clusters Explained
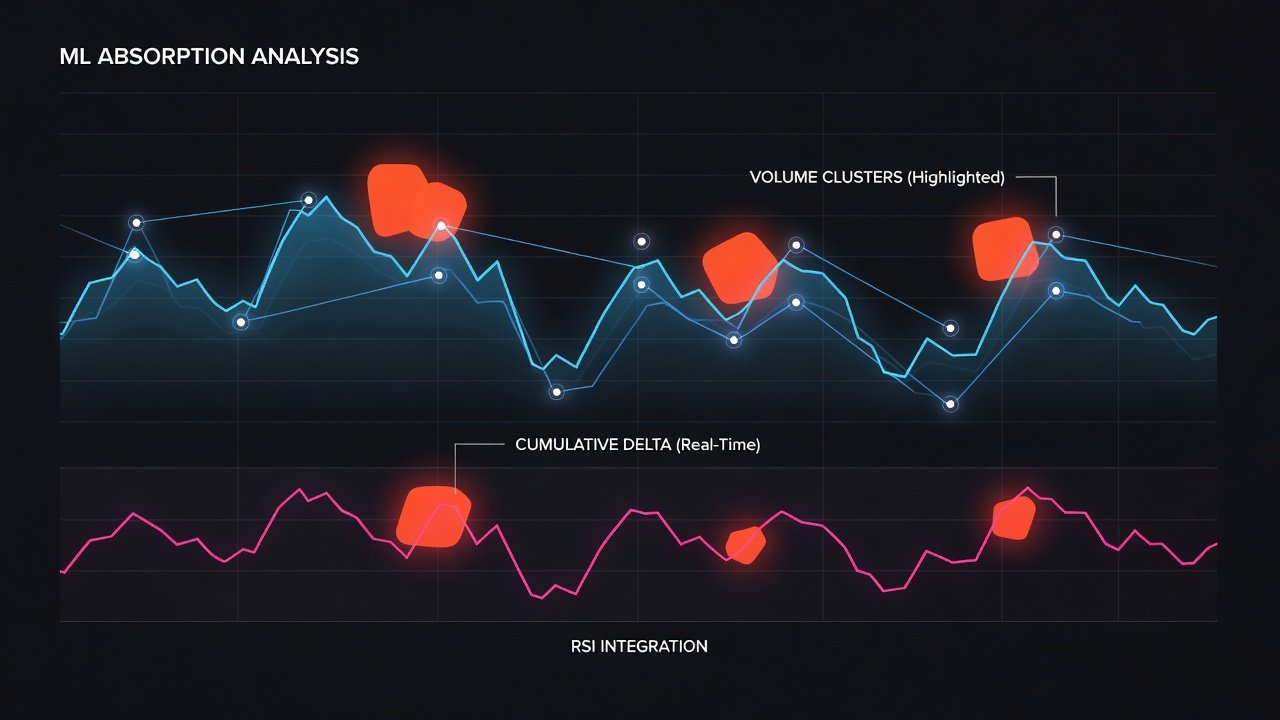
Cumulative delta tracks the running difference between buy and sell volume throughout a trading session, revealing whether aggressive buyers or sellers dominate the market. Positive cumulative delta suggests institutional accumulation, while negative readings point to distribution. Volume clusters highlight price levels where significant trading activity occurs, often acting as strong support or resistance zones because they represent areas of high liquidity and participant interest. AI models process these metrics in real time to filter noise and highlight high-probability zones that human analysts might overlook during rapid price swings.
When integrated with RSI, which measures momentum on a 0-100 scale, traders receive confirmation on whether a trend is overextended. For example, a rising cumulative delta paired with an RSI above 70 may indicate potential exhaustion, prompting caution or profit-taking. Volume profile analysis further refines these signals by showing value areas where most trading occurred, helping AI systems predict where price is likely to gravitate next.
Step-by-Step Integration of Machine Learning Models with Real-Time Feeds
Follow these detailed steps to build an AI-augmented order flow system that works reliably in live markets:
- Connect real-time feeds from exchanges via secure APIs, ensuring low-latency connections under 50 milliseconds for accurate tick-level data.
- Preprocess data streams to calculate cumulative delta on multiple timeframes while identifying volume clusters using clustering algorithms like DBSCAN or k-means.
- Train supervised learning models such as random forests or neural networks on historical patterns labeled with subsequent price outcomes, incorporating features like delta divergence and cluster density.
- Incorporate RSI and complementary oscillators as additional features in the model feature set to improve signal robustness across different market regimes.
- Deploy models for live inference using containerized environments, generating alerts on institutional absorption with probability scores and confidence intervals.
- Implement continuous retraining pipelines that update models weekly based on recent market data to adapt to evolving conditions.
This pipeline allows detection of large block trades hidden in the tape, confirming sector rotations such as those seen in technology and healthcare during early 2026. Backtesting frameworks should include walk-forward optimization to avoid overfitting.
Practical Examples from Recent Tech and Sector Rotations
Consider the 2026 tech rotation where AI chipmakers saw heavy institutional buying amid earnings beats. Order flow data showed positive cumulative delta divergence from price action, confirmed by volume clusters forming at key support levels around previous highs. AI models flagged these setups days before broader market recognition, enabling timely entries with favorable risk-reward ratios. Traders monitoring semiconductor names captured moves exceeding 15 percent in under two weeks.
In contrast, energy sector rotations displayed absorption patterns where large sell orders were absorbed without significant price breakdown, signaling accumulation by long-term funds. AI-augmented tools helped avoid false breakdowns and positioned traders for subsequent rallies driven by supply disruptions. Another example from healthcare showed volume clusters aligning with RSI oversold readings during a rotation out of growth stocks, providing clear entry points for mean-reversion strategies.
Traditional vs AI-Augmented Setups: Key Comparisons
Traditional order flow relies on manual chart reading and basic software platforms, which can lag in volatile conditions and introduce subjective bias. Traders must constantly monitor multiple screens, leading to fatigue and missed signals. AI-augmented setups process thousands of data points instantly, reducing human bias and improving pattern recognition accuracy through ensemble methods. Backtesting on 2025-2026 data shows AI versions outperform manual methods by identifying subtle divergences 30-40 percent faster on average.
However, traditional methods provide full transparency that some experienced traders prefer for regulatory or psychological reasons. The optimal approach often combines both, using AI for initial screening of opportunities and human judgment for final trade decisions and position sizing. Hybrid systems also allow customization of model thresholds based on personal risk tolerance.
Risk Management Strategies for AI Order Flow Trading
Effective risk management is critical when deploying AI-driven signals. Always define position sizes based on account risk limits of 1-2 percent per trade. Use stop-loss orders placed beyond recent volume clusters to account for normal noise. Monitor model drift by tracking prediction accuracy over rolling 30-day windows and pause trading if accuracy drops below 60 percent. Diversify across uncorrelated assets to mitigate sector-specific shocks. Finally, maintain detailed trade logs that include model confidence scores for post-trade analysis.
Checklist for Spotting Absorption Patterns
- Monitor cumulative delta for divergence from price action on at least two timeframes.
- Identify volume clusters exceeding average levels by 200 percent or more at key support or resistance.
- Cross-reference with RSI for overbought or oversold conditions above 70 or below 30.
- Watch for large block trades that fail to move price significantly despite high volume.
- Confirm signals with multiple timeframes and correlated assets before entering positions.
- Validate overall setup against broader market indices and sector performance.
- Assess liquidity conditions to ensure exits can be executed without slippage.
- Review recent news catalysts that might influence institutional behavior.
Common Mistakes to Avoid
Many traders overfit their AI models to past data without proper out-of-sample testing, leading to poor live performance. Ignoring latency in data feeds can cause signals to arrive too late for execution. Another frequent error is relying on a single indicator without confirmation from complementary metrics like volume profile or order book imbalance. Failing to account for overnight gaps or news events also undermines even the best AI setups.
FAQs on Data Sourcing and Backtesting Accuracy
How do traders source reliable order flow data? Reputable platforms aggregate tick data from major exchanges. Always verify feed latency and completeness for your asset class, and consider direct exchange connections where possible.
What backtesting accuracy can be expected? Rigorous out-of-sample testing on 2025-2026 data typically yields 65-75 percent directional accuracy when models include multiple indicators, though results vary by market regime and asset liquidity.
Are there regulatory considerations? Traders should review guidelines from SEC and Federal Reserve resources on algorithmic trading compliance, as well as CFTC rules for futures markets.
How often should models be retrained? Weekly retraining on recent data helps maintain relevance, especially during earnings seasons or macroeconomic shifts.
Conclusion
AI-driven order flow analysis offers advanced traders a powerful framework for navigating 2026 markets with greater precision. By mastering cumulative delta, volume clusters, and integration with RSI, professionals can better anticipate institutional moves and confirm trends across rotations. Implementing the steps, checklists, and risk controls outlined here positions traders to capitalize on opportunities while managing downside exposure in volatile environments. Continuous learning and disciplined execution remain the keys to long-term success with these advanced techniques.
No comments yet. Be the first!