 Bullish Portfolio

Why Active Investing Will Dominate in 2026
In the evolving 2026 market landscape, marked by AI disruptions, geopolitical tensions, and interest rate fluctuations, passive indexing falls short. Active investing—where you handpick opportunities based on research and timing—allows savvy investors to outperform benchmarks. Studies from Morningstar show active funds beating passive ones in volatile periods by up to 2-3% annually. This guide explores seven cutting-edge strategies, complete with mechanics, tools, real-world wins, risks, and management tips.
1. Momentum Trading: Ride the Winners
Momentum trading capitalizes on stocks showing strong recent performance, betting they'll continue upward. It works on the principle that trends persist due to investor herding and earnings momentum.
Key Tools & Indicators:
- Relative Strength Index (RSI): Above 70 signals overbought; enter on pullbacks.
- Moving Average Convergence Divergence (MACD): Bullish crossovers trigger buys.
- 52-week highs: Platforms like TradingView or Thinkorswim for scans.
Real-World Example: In 2023, NVIDIA (NVDA) surged 239% on AI hype; momentum traders entering post-earnings rode it to new highs.
Risks & Management: Sharp reversals (whipsaws). Use 5-10% trailing stops and position sizing under 2% per trade. Diversify across 10+ holdings.
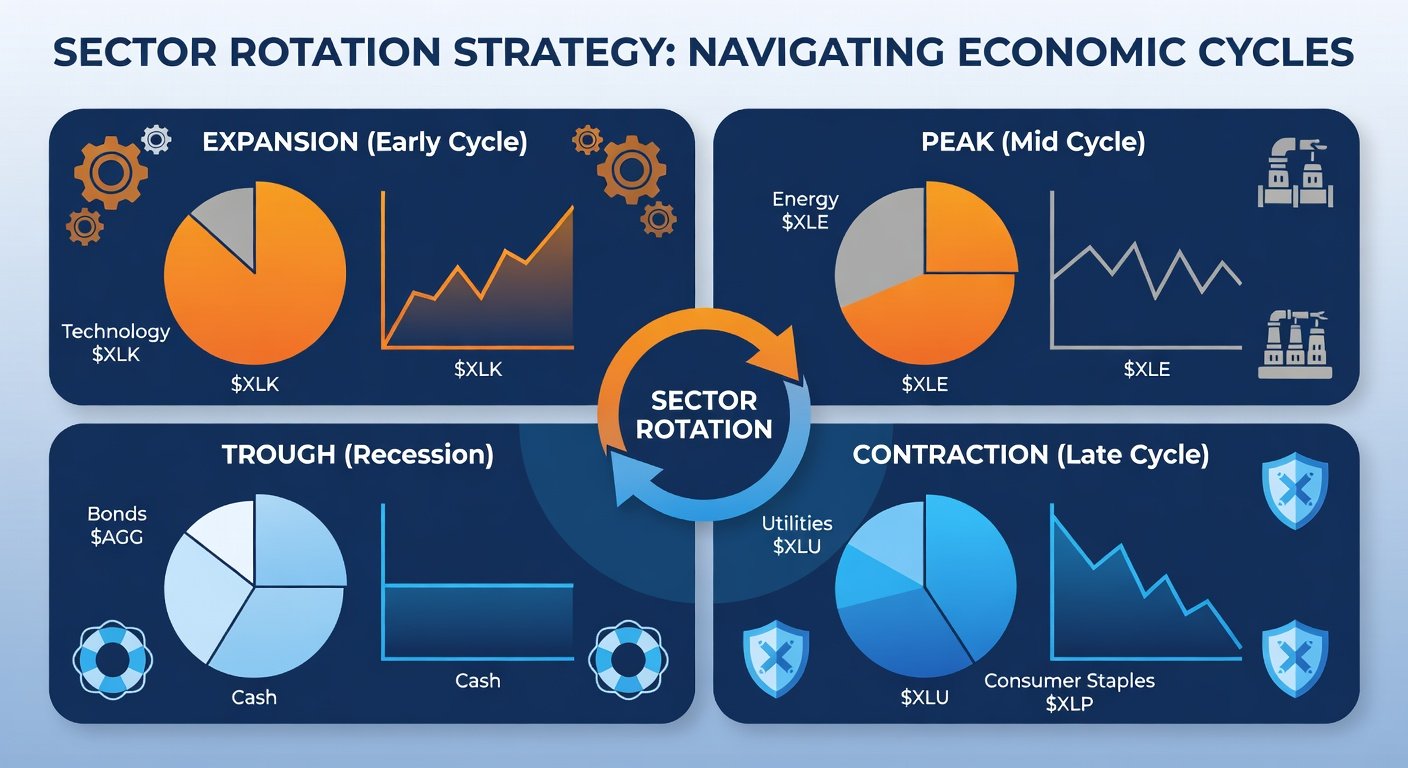
2. Sector Rotation: Surf Economic Cycles
Sector rotation shifts capital to outperforming industries based on economic phases—e.g., tech in expansion, utilities in contraction. Tools like ETFs (XLK for tech, XLU for utilities) enable quick pivots.
Key Tools & Indicators:
- Yield Curve: Steepening favors cyclicals.
- Leading Economic Index (LEI) from Conference Board.
- Relative Strength vs. S&P 500.
Real-World Example: Post-2020, rotation from tech to energy boosted XLE ETF by 60% as oil rebounded.
Risks & Management: Mistimed shifts. Rebalance quarterly, use 20% max per sector, and pair with stop-losses at 8%.
3. Value Stock Picks: Unearth Hidden Gems
Value investing buys undervalued stocks trading below intrinsic worth, using metrics like low P/E or high free cash flow yield. In 2026, with rate cuts, value rebounds strongly.
Key Tools & Indicators:
- Price-to-Book (P/B) <1.0.
- Discounted Cash Flow (DCF) models in Excel or Finbox.
- Piotroski F-Score for financial health.
Real-World Example: Berkshire Hathaway's bets on Occidental Petroleum yielded 150%+ returns as energy undervaluation corrected.
Risks & Management: Value traps (deteriorating firms). Screen for improving earnings, hold 1-3 years, allocate <5% per pick.
4. Quality Factor Investing: Bet on Resilience
Quality focuses on companies with high ROE, stable earnings, and low debt—resilient in downturns. Ideal for 2026's uncertainty.
Key Tools & Indicators:
- Gross Profitability (Gross Profit/Assets).
- Altman Z-Score for bankruptcy risk.
- Quality ETFs like QUAL.
Real-World Example: Microsoft (MSFT) exemplified quality, gaining 50%+ in 2022 bear market via cloud dominance.
Risks & Management: Premium pricing. Combine with momentum filters, rebalance semi-annually, cap at 15% portfolio weight.
5. Growth at a Reasonable Price (GARP): Balanced Growth
GARP seeks growth stocks not overly expensive, blending value and growth via PEG ratio <1.
Key Tools & Indicators:
- PEG Ratio (P/E divided by growth rate).
- EPS growth >15%.
- Stock screeners like Yahoo Finance.
Real-World Example: Shopify (SHOP) in 2021: PEG under 1 led to 100%+ rally on e-commerce boom.
Risks & Management: Growth slowdowns. Use earnings beats as confirmation, 3-7% stops, diversify 8-12 stocks.
6. Pairs Trading: Market-Neutral Profits
Pairs trading longs an undervalued stock and shorts a correlated overvalued one, profiting from convergence. Low beta for volatile 2026.
Key Tools & Indicators:
- Z-Score of price ratio (mean reversion).
- Cointegration tests in Python (statsmodels).
- Brokers like Interactive Brokers for shorting.
Real-World Example: Coke vs. Pepsi pairs yielded steady 10-15% annualized in stable consumer sectors.
Risks & Management: Divergence blowups. Exit at 2SD, equal dollar neutrality, limit to 20% portfolio.
7. Event-Driven Strategies: Capitalize on Catalysts
Event-driven bets on mergers, earnings, or spin-offs using options or stock positions.
Key Tools & Indicators:
- Merger Arb spreads via 13D filings.
- Implied volatility crush post-events.
- Options chains on Thinkorswim.
Real-World Example: Activision Blizzard acquisition by Microsoft delivered 45% arb profits despite delays.
Risks & Management: Deal breaks. Hedge with puts, size small (1-2%), monitor news via Bloomberg terminal.
Outperforming Passive: The 2026 Edge
Passive S&P trackers lag in regime shifts; active strategies adapt via alpha generation. Backtests show these approaches netting 5-10% excess returns. Start small, paper trade, and track via journals. With discipline, thrive in 2026's dynamic markets.

No comments yet. Be the first!