 Bullish Portfolio
Introduction to Dynamic ETF Blending in 2026
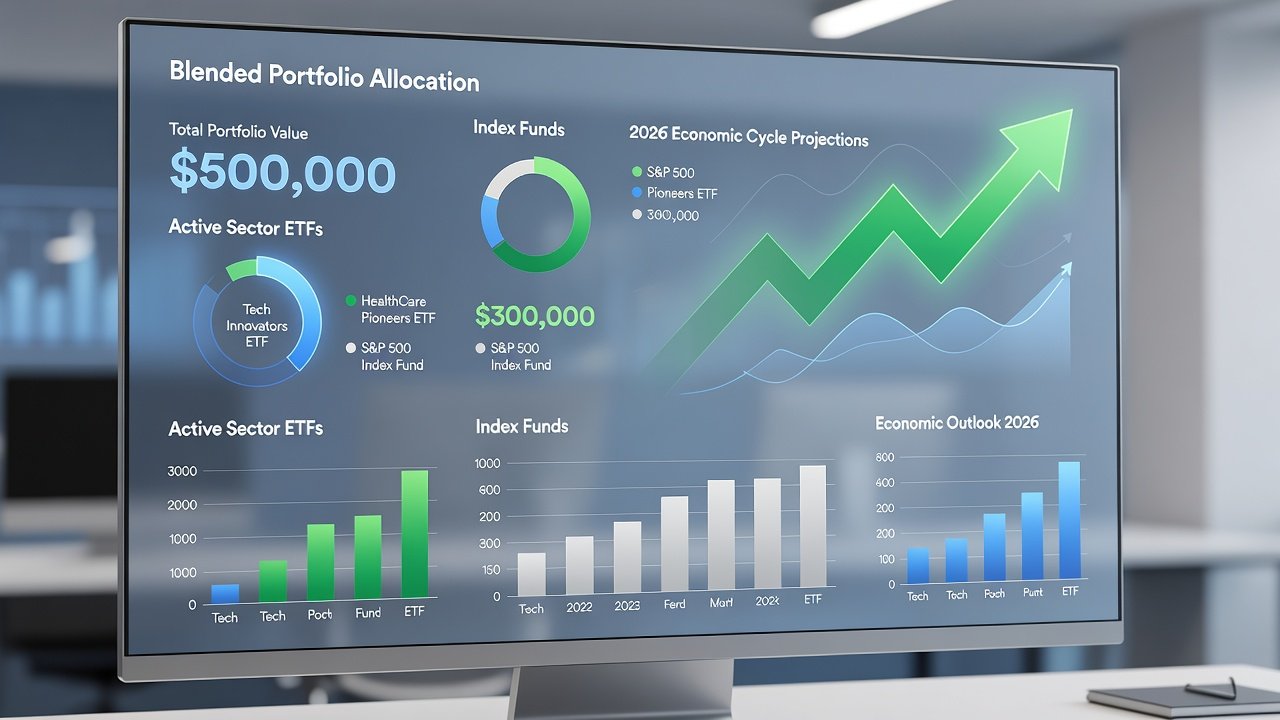
As economic cycles evolve in 2026, investors are increasingly turning to sophisticated approaches that combine the precision of active sector ETFs with the stability of broad index funds. This blending strategy enhances diversification while capitalizing on sector-specific opportunities in areas like technology and healthcare. By integrating these assets, portfolios can adapt more effectively to shifting market conditions driven by innovation, regulatory changes, and macroeconomic trends. The core appeal lies in balancing active management’s potential for outperformance with passive indexing’s cost efficiency and broad exposure. This article explores proven allocation models, cycle indicators, and practical reallocation methods to help advanced investors optimize their holdings for resilience and growth.
Understanding Active Sector ETFs vs. Core Index Funds
Active sector ETFs focus on specific industries, employing managers who select holdings based on research and forecasts. In contrast, core index funds track major benchmarks like the S&P 500, offering low-cost, market-wide exposure. Blending them allows targeted bets on high-growth areas without abandoning foundational stability. Tech and healthcare sectors stand out for 2026 due to ongoing advancements in artificial intelligence, biotechnology, and personalized medicine. Investors often overweight these through active ETFs while maintaining 60-70% in index funds for ballast. This hybrid approach draws on the strengths of both styles, reducing the impact of any single underperforming component.
2026 Economic Shifts and Key Cycle Indicators
Economic cycles in 2026 are expected to feature volatility from technological disruption, policy adjustments, and global supply chain realignments. Key indicators include GDP growth rates, Federal Reserve interest rate decisions, yield curve shapes, and relative sector earnings momentum. Monitoring these helps determine when to tilt toward active sector exposure. For instance, strong earnings in healthcare during recovery phases signal opportunities for increased active allocation. Investors should review monthly economic reports and quarterly earnings data to time adjustments effectively, ensuring the blend remains aligned with prevailing conditions rather than reacting emotionally to short-term noise.
Allocation Models for 2026 Economic Shifts
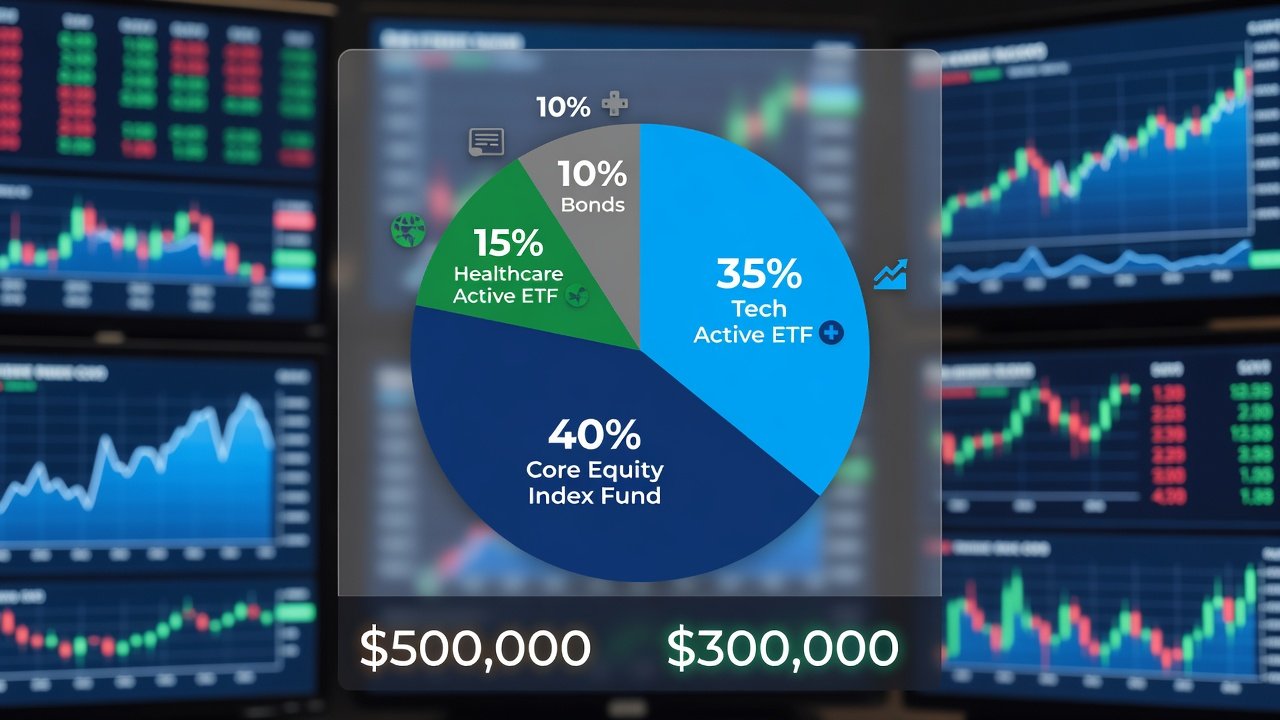
Effective models start with assessing cycle phases—expansion, peak, contraction, or recovery—using indicators such as GDP growth, interest rates, and sector earnings. A sample 60/40 split might allocate 40% to active tech and healthcare ETFs and 60% to core index funds during expansionary periods. More aggressive models increase active exposure to 50% when indicators signal sector momentum. Conservative approaches cap it at 30% to prioritize downside protection. These frameworks draw from established diversification principles discussed on Investopedia. Additional considerations include incorporating bond index components for income stability during uncertain phases, creating layered protection across asset classes.
Step-by-Step Reallocation Tactics
- Monitor key cycle indicators monthly, including yield curve movements and sector relative strength, using free economic calendars from government sources.
- Review current portfolio weights quarterly and identify drifts exceeding 5% from targets, adjusting only when thresholds are breached to avoid overtrading.
- Reallocate gradually by directing new contributions first, minimizing transaction costs and tax events in taxable accounts.
- Rebalance fully during significant shifts, such as policy announcements or earnings seasons, while maintaining overall risk parameters.
- Document decisions and outcomes to refine future cycles based on performance data and lessons learned from each economic phase.
Risk Comparisons and Mitigation Strategies
Active sector ETFs carry higher volatility and potential underperformance versus benchmarks, while index funds provide smoother returns but limited upside capture. Blended portfolios reduce overall risk through correlation benefits, as sector rotations often offset broad market declines. For example, during simulated contraction scenarios, a mix with 35% active tech, 15% active healthcare, and 50% index funds showed moderated drawdowns compared to pure strategies. Mitigation involves regular stress testing, setting stop-loss rules on active portions, and maintaining emergency cash reserves outside the blend. This balanced risk profile makes the approach suitable for intermediate to advanced investors seeking both growth and preservation.
Real-World Portfolio Examples
Consider a $500,000 growth-oriented portfolio: 25% in active tech ETFs, 15% in active healthcare ETFs, 40% in total market index funds, and 20% in bond index funds. During an expansion phase, this setup captured sector gains while the index core provided steady compounding. A more conservative $300,000 retirement portfolio might use 20% active tech, 10% active healthcare, 50% equity index, and 20% fixed income, emphasizing stability. These examples illustrate how scaling active exposure according to risk tolerance and cycle stage delivers adaptable results without excessive complexity.
Best ETFs for Sector Rotation and Implementation Tips
Popular choices for tech and healthcare include established active ETFs known for liquidity and manager expertise. Pair these with low-cost index options like those tracking the Russell 3000. Implementation tips include using limit orders for entries, reviewing holdings overlap quarterly, and aligning rebalancing with tax-year planning. Further insights on ETF structures are available via SEC.gov resources on exchange-traded products, helping investors understand regulatory safeguards that support market integrity.
Mistakes to Avoid in Blended ETF Strategies
- Over-allocating to active sectors without monitoring correlations, which can amplify losses during downturns.
- Ignoring fees and liquidity differences that erode returns over multiple cycles.
- Failing to rebalance after major economic data releases, allowing unintended risk creep.
- Chasing recent performance instead of adhering to cycle indicators and predefined allocation bands.
Practical FAQs on Fees, Liquidity, and Tax Implications
What are typical expense ratios for these blended holdings?
Active sector ETFs often range from 0.40% to 0.75% annually, while core index funds stay below 0.10%. The blended average remains competitive with pure active strategies, supporting long-term compounding when kept in check.
How does liquidity compare between active ETFs and index funds?
Both asset types trade intraday on exchanges with tight spreads for major products, supporting efficient entry and exit even during volatile periods and allowing investors to respond quickly to cycle changes.
What tax considerations arise from reallocation?
Rebalancing in taxable accounts may trigger capital gains. Using tax-advantaged accounts or tax-loss harvesting helps manage liabilities, as outlined in guidance from Federal Reserve economic publications. Investors should also track holding periods to optimize long-term capital gains rates.
Conclusion
Blending active sector ETFs with index funds equips investors for 2026 cycles by merging targeted growth with resilient diversification. Implementing the models, tactics, and safeguards described positions portfolios for adaptability and long-term success across varying economic environments.


No comments yet. Be the first!