 Bullish Portfolio

Introduction to Bullish Growth Stock Selection in 2026
Navigating equity markets requires disciplined approaches, especially when targeting growth stocks poised for strong upward momentum. This guide provides practical frameworks for identifying bullish opportunities amid evolving 2026 conditions, focusing on financial analysis, sector dynamics, and risk controls rather than specific recommendations. Investors at beginner to intermediate levels often struggle with information overload, making structured methods essential for consistent results. Effective strategies emphasize earnings sustainability, competitive positioning, and macroeconomic alignment to filter opportunities systematically while adapting to shifting market regimes.
Success in this area stems from combining quantitative metrics with qualitative sector insights. Rather than relying on hype or short-term trends, the focus remains on companies demonstrating scalable business models supported by real demand drivers. Throughout this article, readers will find step-by-step processes, real-world illustrative scenarios, and decision frameworks that can be applied immediately to personal research routines.
Key Financial Metrics for Evaluating Growth Potential
Successful stock selection begins with core financial indicators that signal expansion capacity. Revenue growth rates, earnings per share trends, and return on invested capital offer foundational signals of operational health. Additionally, free cash flow margins help assess operational efficiency without heavy reliance on debt financing, revealing whether growth is self-sustaining. Investors should calculate compound annual growth rates over multiple years to distinguish temporary spikes from durable trends.
Examine price-to-earnings growth ratios to gauge whether valuations align with projected expansion. High-growth names often trade at premiums, so cross-reference these with balance sheet strength, including low leverage ratios and adequate liquidity reserves. For instance, a technology firm showing 25% annual revenue increases alongside rising gross margins indicates scalable operations, whereas similar top-line growth paired with margin compression may point to intensifying competition. Always compare these metrics against industry medians to contextualize performance.
Learn more about financial ratios from Investopedia.
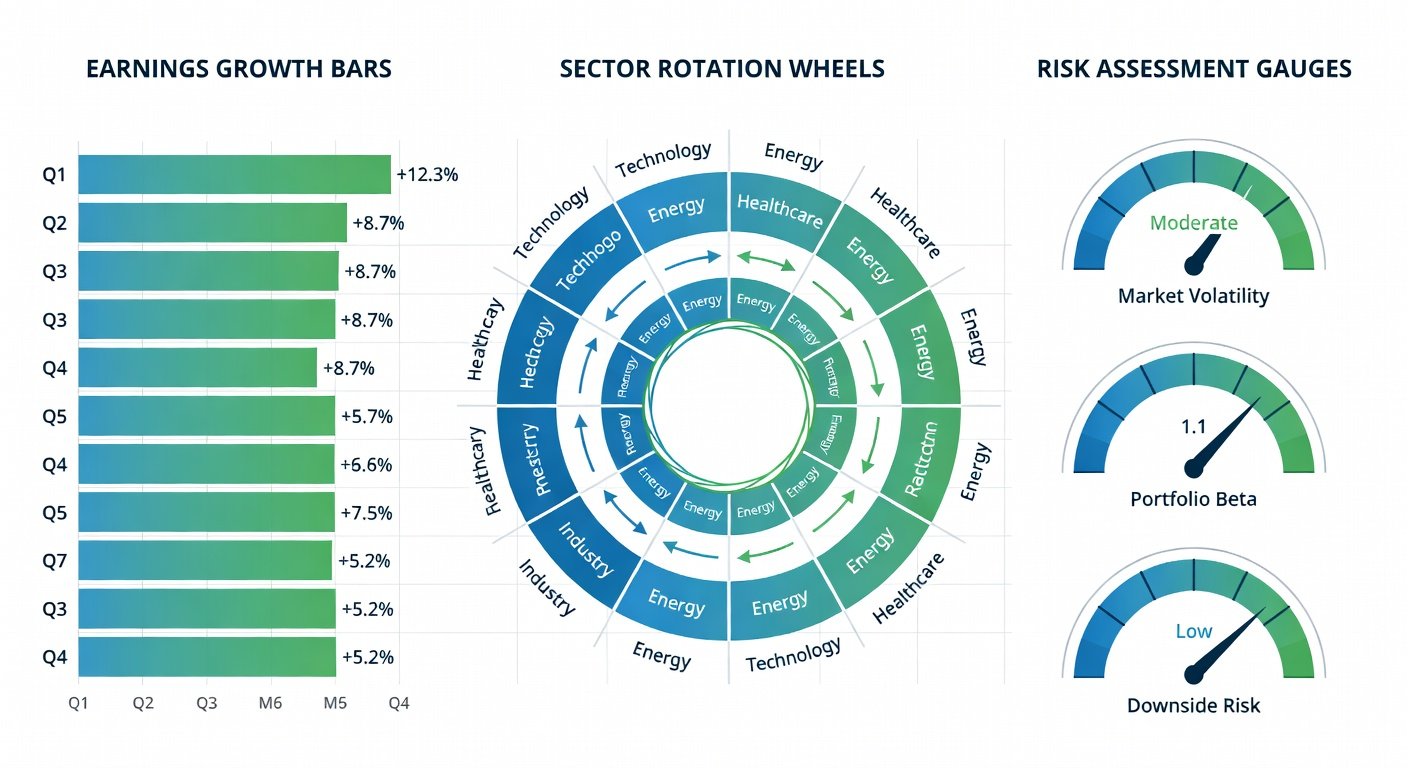
Sector Rotation Analysis for 2026 Markets
Sector performance shifts with economic cycles, technological advances, and policy changes. In 2026, monitoring rotations into high-innovation areas such as artificial intelligence infrastructure, renewable energy scaling, and healthcare biotechnology can uncover bullish setups. Track relative strength indicators across sectors using broad market indexes to identify leadership changes early. This analysis involves reviewing historical rotation patterns during similar macroeconomic environments, such as periods of moderate interest rates or accelerating digital adoption.
Compare year-over-year performance differentials and correlate them with leading economic indicators like manufacturing output or consumer spending data. This approach helps position portfolios ahead of sustained sector leadership rather than chasing past winners. Practical application includes maintaining a simple spreadsheet that logs sector ETF performance weekly, highlighting those breaking out to new highs on elevated volume. Such discipline prevents emotional allocation shifts and supports data-driven rotation decisions.
Building and Maintaining an Effective Watchlist
A dynamic watchlist serves as the foundation for timely decisions. Start by screening for companies demonstrating consistent revenue expansion above industry averages alongside improving profit margins. Include criteria for market capitalization ranges that match your risk tolerance and liquidity needs, ensuring candidates remain tradable without excessive slippage. Segment the watchlist into tiers based on conviction levels, allowing focused monitoring of higher-potential names.
Update the list quarterly, incorporating new entrants from earnings reports and removing those failing momentum thresholds. Tools from major exchanges facilitate ongoing monitoring without constant manual effort. Incorporate qualitative notes on management execution and product pipelines to enrich the quantitative data. Over time, this evolving list becomes a personalized database that accelerates research when market conditions favor new entries.
Access official filings and disclosures via the SEC.
Using Earnings Momentum Data Effectively
Earnings momentum reflects accelerating or decelerating business performance. Focus on sequential quarter-over-quarter improvements in both top-line and bottom-line figures, supplemented by forward guidance quality. Positive surprises relative to analyst estimates often precede extended price advances when supported by fundamental drivers such as new customer wins or margin expansion initiatives. Review not only the headline numbers but also segment-level breakdowns to confirm broad-based strength.
Incorporate revisions to consensus estimates as a secondary filter. Upward revisions across multiple periods strengthen conviction, while tracking beat rates over several quarters provides historical context for reliability. A practical example involves a healthcare company that consistently exceeds estimates by 8-12% for four consecutive quarters while raising guidance; this pattern frequently correlates with sustained outperformance as institutional investors increase positions. Cross-reference momentum signals with volume trends to validate genuine interest rather than speculative noise.
Risk Assessment Frameworks
Every growth opportunity carries downside exposure. Apply a multi-factor risk model incorporating volatility measures, beta relative to benchmarks, and scenario analysis for interest rate or regulatory shifts. Stress-test potential holdings against moderate drawdown assumptions to quantify portfolio impact, including simulations of 20-30% sector corrections. This process highlights vulnerabilities that single-metric screens often miss.
Diversification across uncorrelated names and sectors mitigates concentration risk. Regular rebalancing maintains intended exposure levels as individual positions appreciate. Consider correlation matrices when adding new holdings to avoid unintended overlaps in economic sensitivities. Investors who document these assessments in a simple journal develop sharper intuition for position sizing over successive market cycles.
Avoiding Common Valuation Traps with Examples
Overpaying for growth remains a frequent error. Consider a hypothetical software firm trading at 80 times forward earnings despite slowing user acquisition; this setup often signals mean reversion risk despite prior momentum. Cross-check multiples against peer averages and historical ranges within the same industry to identify outliers. Another trap involves ignoring cash conversion cycles. A company reporting strong GAAP earnings yet burning cash through aggressive expansion may face sudden funding pressure, particularly if capital markets tighten.
Real-world patterns show that firms with declining return on equity despite revenue gains frequently underperform peers once growth normalizes. Always reconcile reported profits with operating cash flows before committing capital. A third common pitfall is overlooking customer concentration; when one client represents over 25% of revenue, any loss can trigger sharp re-ratings. Applying these filters consistently reduces exposure to value-destructive entries.
Step-by-Step Checklist for Stock Evaluation
- Screen for revenue and earnings growth exceeding 15% annually over three years with accelerating trends in recent quarters.
- Verify positive free cash flow and manageable debt-to-equity ratios below 0.8 where possible.
- Assess sector tailwinds and competitive moats through industry reports and patent analysis.
- Review recent earnings transcripts for management confidence indicators and specific growth catalysts mentioned.
- Calculate risk-adjusted return potential using historical volatility data and beta comparisons.
- Confirm alignment with overall portfolio allocation limits and liquidity requirements for the position size.
- Document qualitative factors such as regulatory risks or key-person dependencies before final inclusion.
Portfolio Allocation Tips for Growth Exposure
Limit aggressive growth allocations to 20-40% of total equity holdings depending on time horizon and risk profile. Blend core holdings with satellite positions sized at 2-5% each to allow meaningful upside without excessive volatility. Rebalance annually or after significant market moves to lock in gains and restore targets. Dollar-cost averaging into new ideas over multiple weeks reduces timing risk associated with entry points.
Monitor overall portfolio beta to ensure growth exposure does not exceed personal risk tolerance during volatile periods. This balanced method supports compounding while preserving capital for opportunistic additions when valuations reset.
Frequently Asked Questions
How do tax implications affect growth stock timing?
Holding periods exceeding one year typically qualify for preferential long-term capital gains rates in most jurisdictions. Investors should coordinate sales with overall tax planning to minimize liability while preserving strategy integrity. Short-term trades may trigger higher ordinary income rates, influencing decisions on when to trim winners.
When is the optimal time to enter positions?
Entries aligned with confirmed earnings beats or sector rotation signals tend to offer better risk-reward profiles. Avoid chasing after extended runs without fresh catalysts; instead, use pullbacks to established support levels for improved entry pricing. Combining technical confirmation with fundamental momentum enhances timing precision.
What role does macroeconomic data play in these strategies?
Broad indicators such as GDP growth, inflation trends, and central bank policies provide context for sector attractiveness. For example, easing monetary conditions often favor growth-oriented areas by lowering discount rates on future earnings. Integrating these macro overlays prevents micro-level analysis from occurring in isolation.
Conclusion
Mastering bullish growth stock selection in 2026 demands rigorous metric analysis, sector awareness, and disciplined risk management. By applying the checklists and frameworks outlined above, investors can build repeatable processes that improve decision quality over time. Consistent application of these principles transforms ad-hoc stock picking into a structured, evidence-based approach capable of adapting to changing market environments.


No comments yet. Be the first!