 Bullish Portfolio
Understanding Order Flow Absorption in 2026 Markets
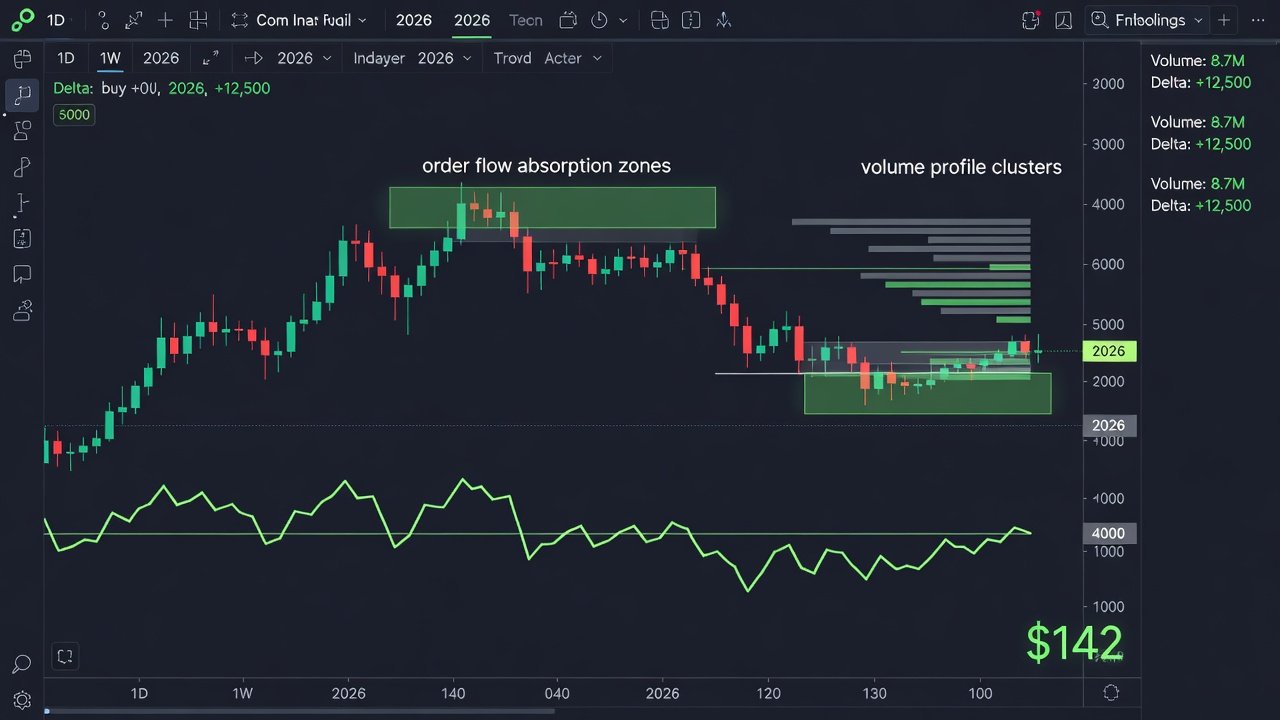
Order flow absorption occurs when large institutional orders are executed without significantly moving the price, indicating smart money accumulation or distribution. In 2026's volatile environment, mastering this concept helps retail traders align with professional flows rather than chasing retail-driven noise. Absorption represents a key moment where aggressive buyers or sellers meet equal opposition, creating a stalemate that often precedes major directional moves. Traders who learn to read these patterns gain an edge by positioning ahead of institutional entries that drive sustained trends.
Step-by-Step Identification of Absorption Zones
Begin by analyzing volume clusters on footprint charts or volume profile tools. Look for high-volume nodes where price stalls despite heavy trading activity. Next, examine cumulative delta: absorption often appears as delta divergence where aggressive buying or selling fails to push price higher or lower. Follow these detailed steps for reliable identification in live 2026 trading sessions.
- Load a footprint chart with bid/ask volume breakdown on your chosen platform.
- Identify clusters exceeding average volume by 150% or more while price remains within a tight range.
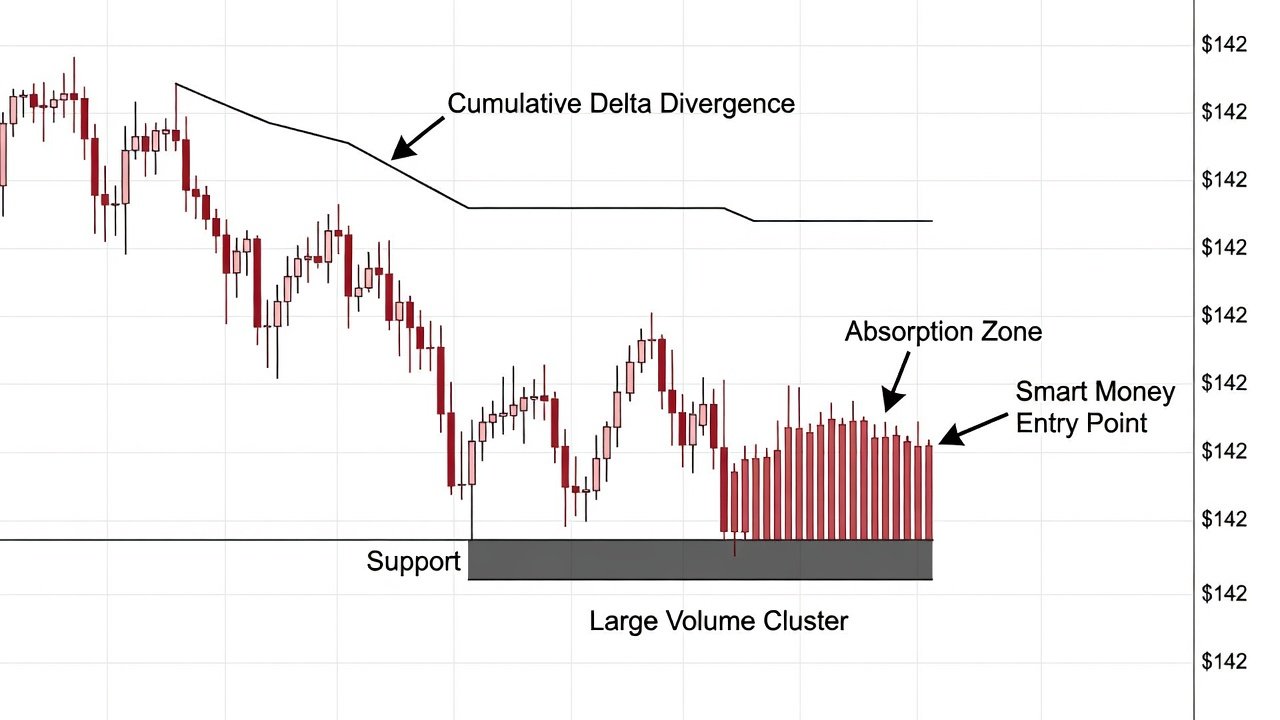
- Check cumulative delta for flattening or reversal while price holds steady, signaling exhaustion of one side.
- Mark the zone on higher timeframes for swing trade context and confirm with multiple sessions.
- Validate the zone by observing subsequent price reactions at the same level during pullbacks.
These steps allow traders to build a repeatable process that filters out random volume spikes common in today's markets.
Real Chart Examples from Recent 2026 Market Trends
Consider a mid-cap technology stock that experienced repeated absorption at the $142 support level during February 2026 sessions. Footprint charts revealed stacked bid volume exceeding 250,000 shares at that price with minimal downside progress, while cumulative delta flattened despite aggressive selling attempts. Price later rallied over 18% within three weeks. Similar patterns appeared in energy sector names where absorption zones formed ahead of OPEC-related announcements, allowing swing traders to enter long positions with defined risk below the cluster.
Comparing Absorption to Basic Volume Analysis
Traditional volume bars show total activity but miss directional intent. Order flow absorption reveals the battle between buyers and sellers at each price level, exposing hidden institutional footprints that basic volume spikes often conceal. Basic volume analysis might flag a spike as bullish, yet without delta context it fails to distinguish between absorption and simple distribution. Absorption analysis adds precision by showing whether large orders were absorbed or overwhelmed the opposing side, providing a clearer picture than standard volume histograms alone.
Integrating RSI and MACD for Confirmation
Combine absorption signals with RSI to confirm oversold or overbought conditions at absorption zones. When absorption forms near RSI readings below 30 on the daily chart, the probability of a reversal increases substantially. Use MACD histogram contraction alongside delta flattening to increase trade probability. This multi-timeframe approach filters weak signals in fast-moving 2026 conditions. For example, a bullish absorption zone coinciding with MACD bullish crossover and RSI divergence offers higher conviction than any single indicator. Traders should wait for all three elements to align before entering swing positions.
Practical Tool Setups in Popular Platforms
Configure Investopedia resources alongside TradingView with Orderflow Footprint and Cumulative Delta indicators enabled. In Sierra Chart or Bookmap, activate volume profile heatmaps and delta divergence alerts set to notify when volume exceeds three times the session average. Set alerts on absorption zones coinciding with key support or resistance levels identified from prior sessions. On Thinkorswim, combine the Volume Profile study with the Delta Divergence custom script and link it to RSI and MACD panes for simultaneous viewing. These setups require initial configuration time but deliver real-time insights during market hours.
Risk Management Tips for Swing Trades
Define clear invalidation levels just beyond the absorption zone to protect capital. Use position sizing based on account risk of 1% per trade, adjusting for volatility measured by average true range. Trail stops using the cumulative delta line to lock in gains as smart money continues to defend the level. Always calculate reward-to-risk ratios exceeding 3:1 before entry, and avoid adding to losing positions even if absorption appears strong. Maintain a trading journal documenting each absorption setup, entry rationale, and outcome to refine future decisions.
Common Pitfalls and How to Avoid Them
- Mistaking high volume alone for absorption—always require delta confirmation before acting.
- Trading low-liquidity names where absorption signals are unreliable and spreads widen dramatically.
- Ignoring broader market context such as economic data releases or sector rotation patterns.
- Over-leveraging on early absorption signals before full zone completion across multiple timeframes.
- Failing to account for overnight gaps that can invalidate zones formed during regular trading hours.
FAQs on Distinguishing Absorption from Fakeouts in Volatile 2026 Conditions
How do I tell real absorption from a fakeout in 2026 volatility? Real absorption shows sustained delta divergence over multiple candles combined with volume clusters; fakeouts typically exhibit quick delta alignment with price breakout and thin volume follow-through.
Which timeframes work best for absorption analysis? Combine 5-minute or 15-minute charts for precise entry timing with daily or 4-hour charts for zone validation and overall trend context.
Can absorption work in all market regimes? It performs best in ranging or low-volatility periods leading into breakouts; avoid trading absorption signals during major news events or extreme volatility spikes.
What tools are essential for beginners? Start with free or low-cost footprint indicators on TradingView before progressing to dedicated order flow platforms like Bookmap or Sierra Chart.
Conclusion
Mastering order flow absorption equips traders with a professional-grade lens for spotting institutional activity in 2026 markets. By combining volume clusters, cumulative delta analysis, and supporting indicators while following disciplined risk rules, swing traders can improve entry accuracy and long-term results. Consistent practice with real chart examples builds the intuition needed to navigate volatile conditions effectively.
No comments yet. Be the first!