 Bullish Portfolio
Introduction to Market Breadth in 2026
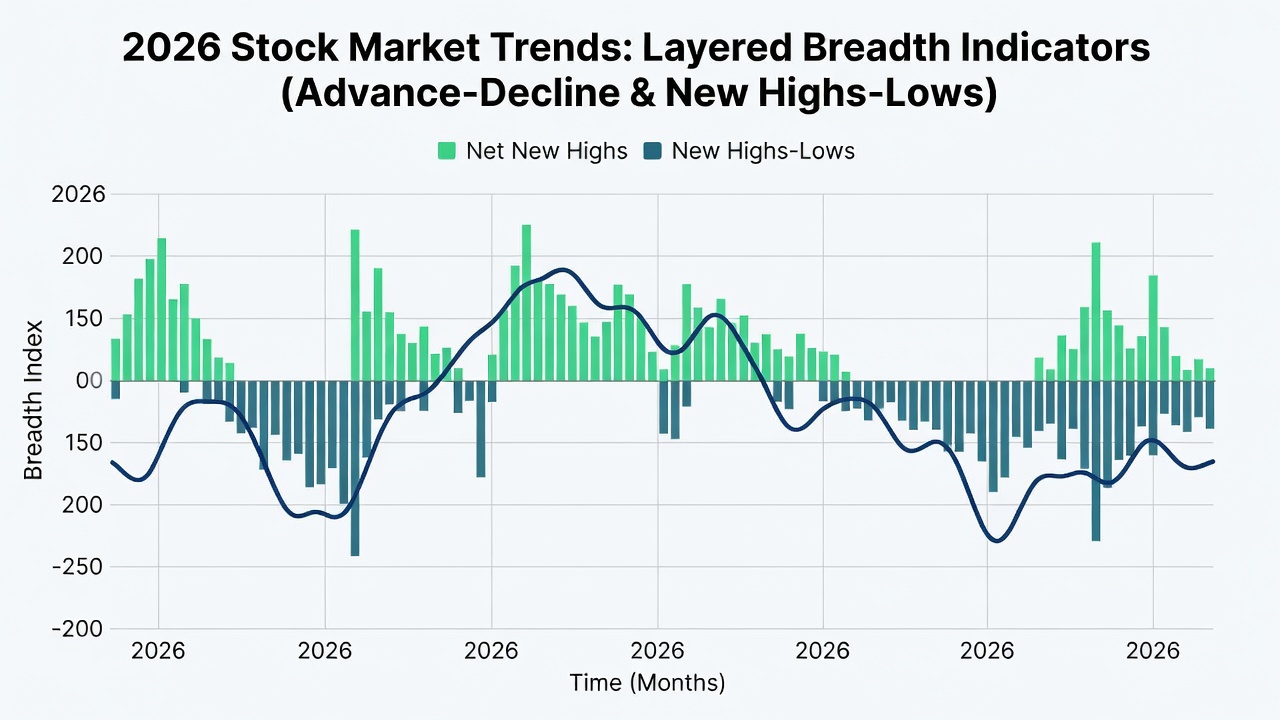
Market breadth indicators provide a comprehensive view of stock market health by analyzing participation across hundreds or thousands of securities rather than focusing exclusively on price movements of major indices. In 2026, as markets navigate shifting economic conditions and heightened volatility, these tools become essential for traders seeking confirmation of trends that may not yet be visible on standard price charts. Breadth data helps identify whether rallies are supported by broad participation or driven by a narrow group of stocks, reducing the risk of being caught in false breakouts.
This how-to guide explores the primary market breadth tools including advance-decline ratios, new highs-lows counts, and up-down volume metrics. Readers will find detailed calculation methods, practical 2026 case studies drawn from major indices, comparisons with traditional single-stock technical analysis, and actionable strategies for spotting divergences. The content also includes workflow integration checklists and example scans to help traders incorporate breadth analysis into daily routines effectively.
Understanding Advance-Decline Ratios
The advance-decline ratio measures the number of stocks advancing versus those declining on a given trading day across a specific exchange. A ratio greater than 1.0 generally indicates positive breadth supporting upward price moves, while values below 1.0 suggest weakening participation. Traders monitor both daily and cumulative versions of this indicator to gauge sustained market strength.
Step-by-Step Calculation
- Collect daily advance and decline figures from exchange reports.
- Divide the number of advancing issues by the number of declining issues to obtain the ratio.
- Calculate a cumulative advance-decline line by adding the daily net advances to the previous day's total.
- Compare the ratio and line against index price action to confirm or contradict trends.
In 2026 volatile sessions, smoothing the ratio with a 10-day moving average can filter out noise and highlight meaningful shifts in participation.
New Highs-Lows Indicator Explained
The new highs-lows indicator counts stocks making 52-week highs compared to those making 52-week lows. Strong breadth is confirmed when new highs significantly outnumber new lows during index advances. This metric often leads price by highlighting when fewer stocks are achieving new peaks, even as benchmarks climb.
Investopedia offers foundational resources on interpreting these statistics across different market regimes.
Up-Down Volume Analysis
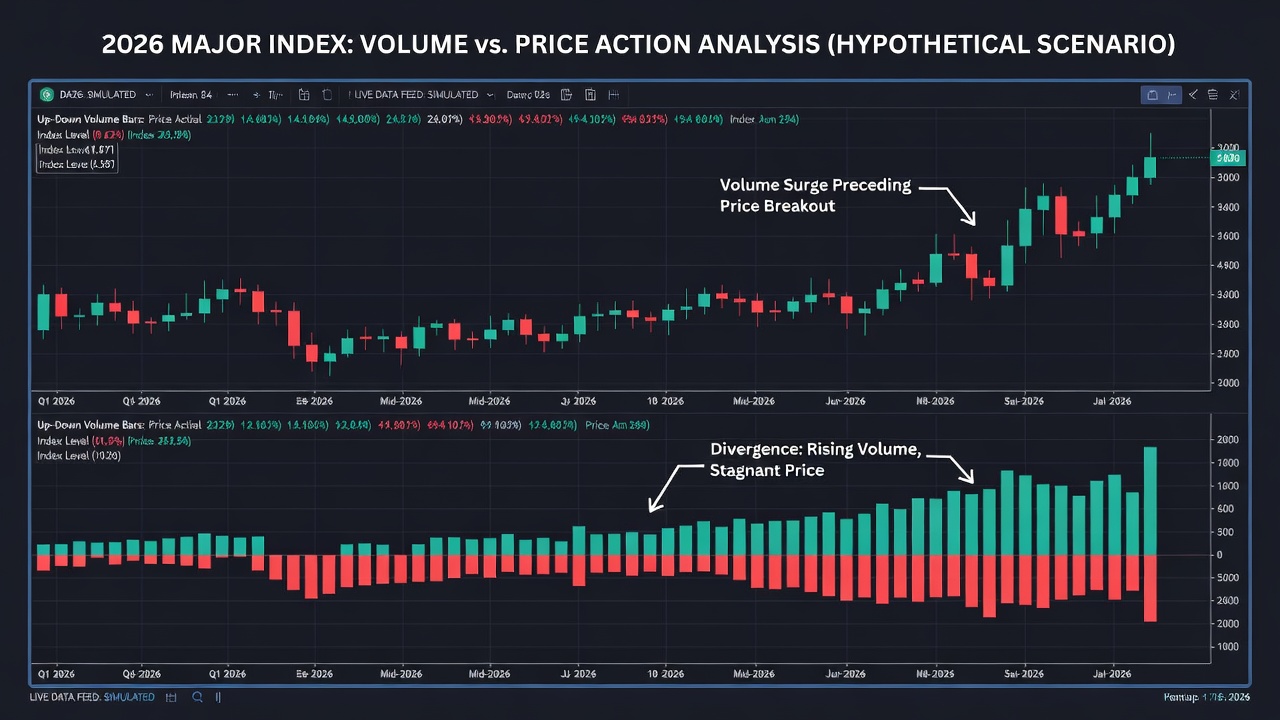
Up-down volume compares the total shares traded in advancing stocks against those in declining stocks. Divergences here frequently precede price reversals because they reveal whether buying or selling pressure is widespread.
Practical Example Scan
- Identify sessions where up volume exceeds down volume by a 2:1 margin or greater.
- Cross-check these readings against closing prices of the S&P 500 or Nasdaq Composite.
- Track multi-day trends in up volume to detect contraction that may signal fading momentum.
- Combine with sector-level volume data for deeper insight into leadership rotation.
2026 Case Studies from Major Indices
Analysis of the S&P 500 during the first quarter of 2026 showed multiple instances where the advance-decline line lagged price highs, indicating narrowing participation. Similar patterns appeared in the Nasdaq Composite, where new highs-lows counts declined even as the index pushed higher on technology leadership alone. These divergences helped traders anticipate short-term corrections of 5 to 8 percent before they materialized in headline prices.
Another example involved the Russell 2000 small-cap index, where up-down volume contracted sharply in late spring 2026 despite modest index gains, warning of underlying weakness that later led to underperformance versus large-cap benchmarks.
Comparing Breadth Tools with Single-Stock TA
Single-stock technical analysis relies on patterns such as moving average crossovers, RSI levels, and candlestick formations applied to individual equities. While effective for timing entries and exits in specific names, it can miss broader market context. Breadth indicators add a macro layer that validates whether a stock's move aligns with overall participation or represents an outlier. Traders who combine both approaches often achieve higher conviction signals and avoid chasing stocks that rise in isolation.
Spotting Divergences: Actionable Tips
Price making successive higher highs while breadth metrics such as the cumulative advance-decline line or new highs-lows ratio trend lower represents a classic bearish divergence. The reverse pattern can signal bullish reversals. Maintain a daily log documenting index closes alongside breadth readings to identify these setups early and prepare risk management plans accordingly.
Integrating Breadth Data into Daily Workflows
Develop a repeatable process that incorporates breadth review at market open and close. Begin each session by checking advance-decline ratios and new highs-lows counts, then review up-down volume at midday to assess participation strength. End-of-day analysis should include updating cumulative lines and noting any divergences for the next trading day.
Sample Daily Checklist
- Record advance-decline ratio and compare to 10-day average.
- Update new highs-lows differential and flag any contraction.
- Review up-down volume ratio and note significant imbalances.
- Cross-reference findings with sector rotation data.
- Document observations in a trading journal for pattern recognition over time.
Common Interpretation Challenges in Volatile Markets
High-volatility periods can produce erratic breadth readings that require additional context. Earnings seasons often inflate daily swings, making smoothed indicators or multi-day averages more reliable. Traders should also account for special situations such as index rebalancing events that temporarily distort participation metrics.
FAQ
How do I handle erratic readings during earnings season? Average multiple days of data to smooth noise and focus on underlying trends rather than single-session outliers.
Which exchanges provide the most reliable breadth data? The NYSE and Nasdaq composite figures deliver the broadest coverage and are widely used by institutional traders.
Can breadth predict exact turning points? Breadth indicators supply probabilistic context and confirmation rather than precise timing forecasts; always combine with price action and risk controls.
What time frames work best for breadth analysis? Daily and weekly charts suit swing traders, while intraday breadth can support shorter-term scalping strategies when used alongside volume profiles.
How should beginners start incorporating these tools? Begin with free exchange data feeds and simple spreadsheets before progressing to specialized charting platforms for automated calculations.
Conclusion
Market breadth indicators equip traders with deeper insight into 2026 market dynamics beyond what price charts alone reveal. Consistent application alongside single-stock technical analysis improves signal quality and helps navigate both trending and volatile environments with greater confidence.
Learn more proven investment strategies to complement breadth analysis.


No comments yet. Be the first!